Effects of Climate Change on Water Demand
Implications and Context for Effects of Climate Change on Urban Water Demands in the Mountain-West
Carly Hansen with Oakridge National Laboratory developed a modeling framework that incorporates multiple drivers of change, uncertainty, and system complexities allowing the user be to address water availability, management, and planning challenges. There are various drivers of change in future residential water use, some of which have clear compounding effects. Strategic planning (e.g. where to focus time and financial resources) requires an understanding of the relative contribution of each of these drivers. Exploring water use through a probabilistic GoldSim model helps address uncertainties inherent with human behavior and multiple scenarios allow for exploration of different drivers of change.
Background
- Climate conditions
- Growth and development patterns
- Behavior, perception, and public understanding of water-related issues
Systems models that incorporate multiple drivers of change, uncertainty, and system complexities can be used to address water availability, management, and planning challenges.
Research Objectives and Questions
- There is uncertainty in potential future climate conditions. How does urban outdoor water use compare between the range of past and future projected conditions, including during extreme periods of drought?
- Utah is expecting large population growth over the coming decades. How are those changes compounded by population growth/development?
- Changing an individual’s water use behavior can be difficult. How much does conservation mitigate changes in demands under various scenarios of potential future climate conditions and growth/development?
Modeling Workflow and Results
A 10-year moving average of the Standardized Precipitation-Evapotranspiration Index (SPEI) [4] was used to forecast climate conditions. The data extends from 1950-2099 based on CCSM4 MACA Downscaled Climate Data [5-6] for Utah Lake (Provo) and Jordan River (SLC) Basins. Over the next 80 years, there is a significant drop in SPEI which reflects generally hotter/drier conditions (refer to Figure 1). |
| Figure 1 - 10-yr moving average SPEI |
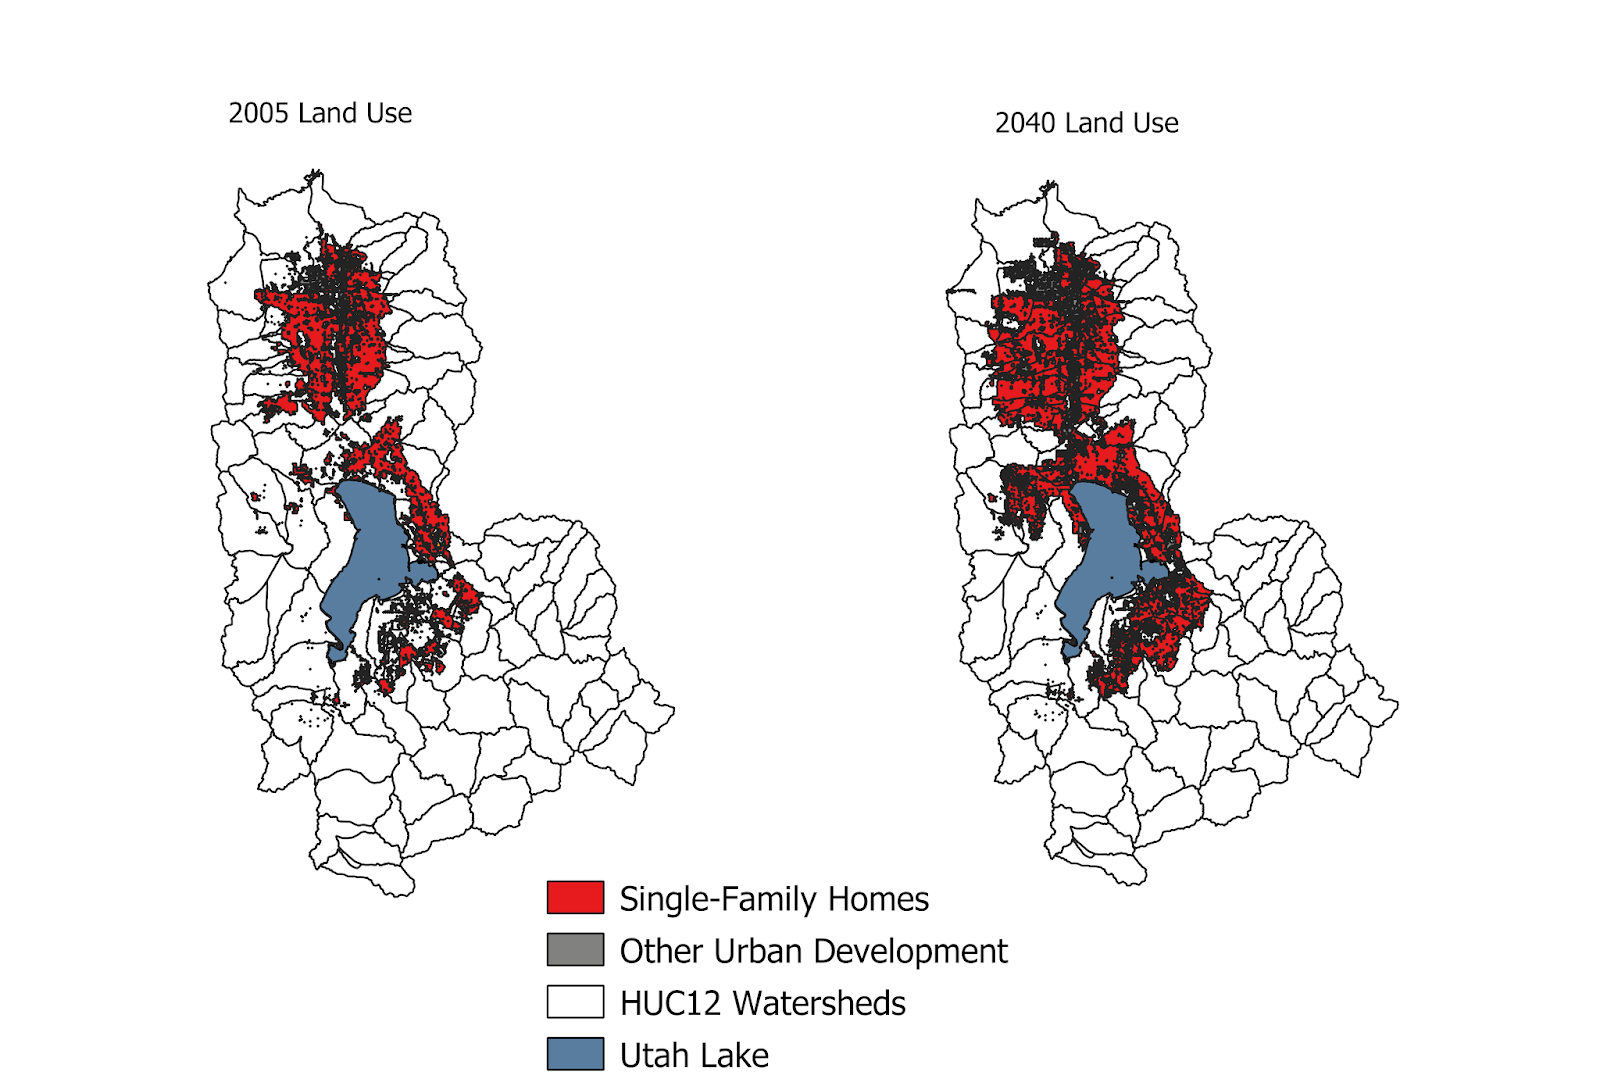 |
| Figure 2 - Land use Change 2005-2040 |
A GoldSim model of the Utah Lake and Jordan River basins was used to represent water deliveries from water supply sources to users (residents, institutions, irrigation), and then their various endpoints (wastewater treatment plants and receiving waters). This modeling platform incorporates inherent uncertainties through Monte Carlo simulations (e.g. allowing variability in daily per capita water use) and is useful for representing complex interactions and feedback between subsystems. A screen capture of part of the GoldSim model is shown in Figure 3.
 |
| Figure 3 - System Model |
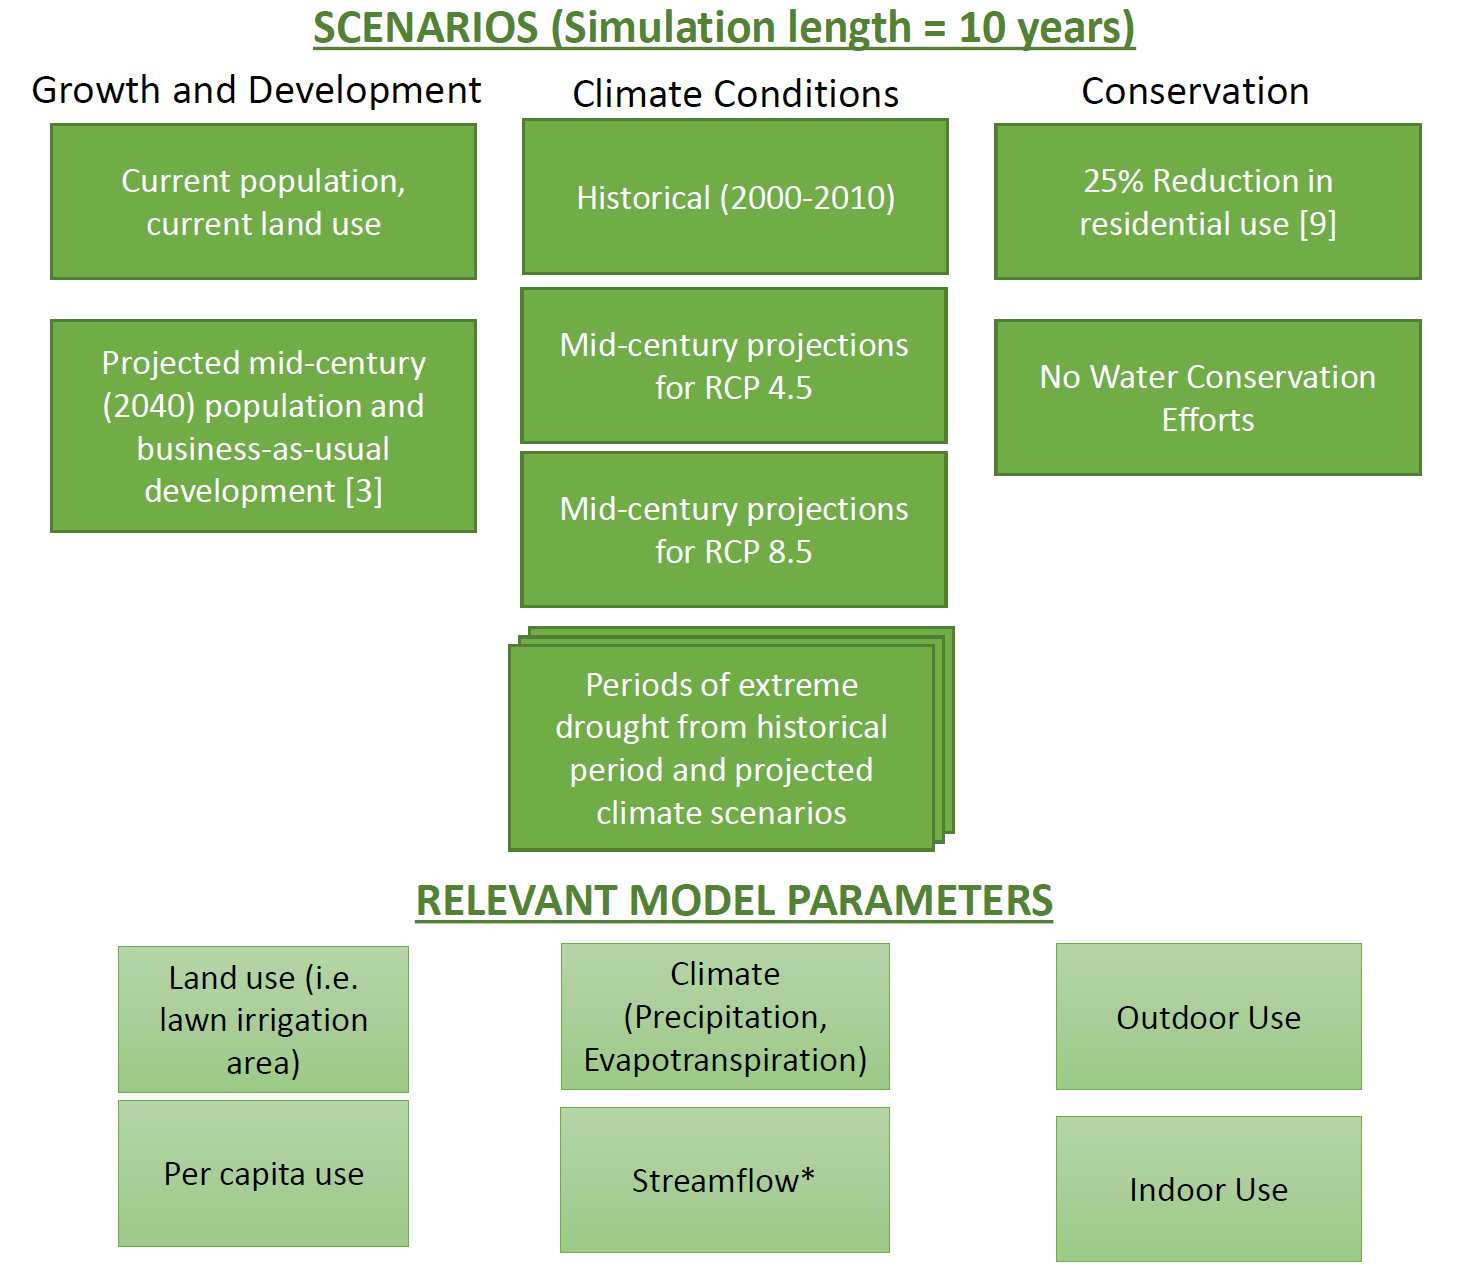 |
| Figure 4 - Scenarios |
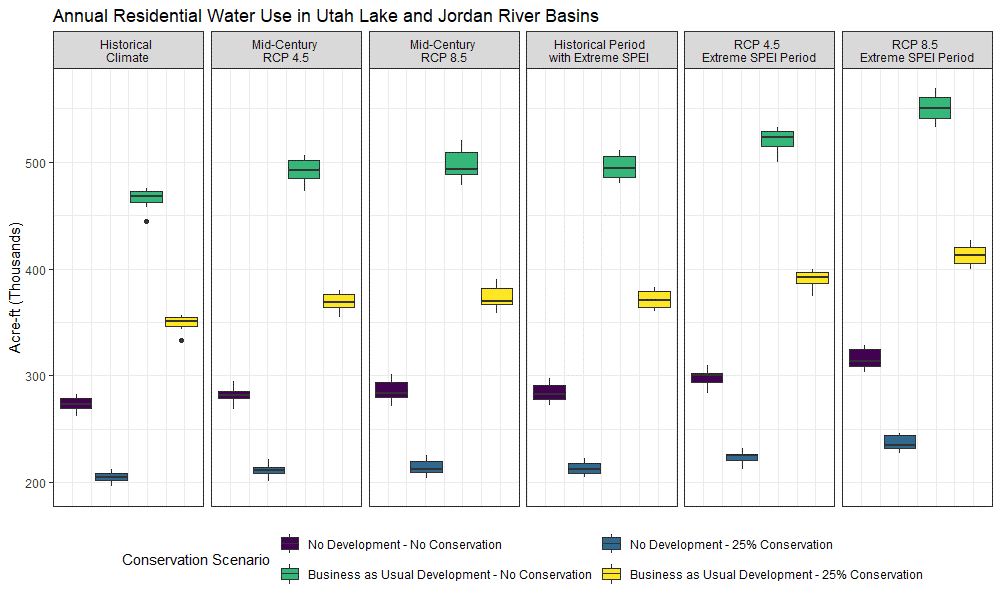 |
| Figure 5 - Annual Residential Water Use |
Key Findings
Strategic development, conservation, and planning are essential for dealing with changing residential outdoor water use and urban water systems.- There are various drivers of change in future residential water use, some of which have clear compounding effects. Strategic planning (e.g. where to focus time and financial resources) requires an understanding of the relative contribution of each of these drivers.
- Exploring water use through a probabilistic model helps address uncertainties inherent with human behavior and multiple scenarios allow for exploration of different drivers of change.
Future Research Opportunities
Residential outdoor water use is only one part of a complex water system. Changes in this part of the system need to be linked to other parts of the system (including surface and groundwater sources, and downstream receiving waters). In this particular system, there are several multi-purpose reservoirs, and any changes in demands will have cascading effects outside of residential water use sector (e.g. energy generation, flood control operations). There are also many opportunities to explore mechanisms of change (e.g. lawn irrigation technologies). Additionally, the modeling framework and many of the data sources presented here are widely applicable and available for other urban water systems in the western United States.Acknowledgements
This article was developed under assistance agreement number 835866-01 awarded by the US Environmental Protection Agency to Dr. Michael Barber. It has not been formally reviewed by EPA. The views expressed in this document are solely those of the authors and do not necessarily reflect those of the agency. EPA does not endorse any products or commercial services mentioned in this publication. Special thanks to Debolina Banerjee from the Department of City and Metropolitan Planning at the University of Utah for processing REMM model data.Contributors:
Carly Hansen, PhD (with Oak Ridge National Laboratory – Environmental Sciences Division, hansench@ornl.gov)
Steve Burian, PhD (with University of Utah – Civil and Environmental Engineering and the U Water Center)
This model was presented at the 2019 American Water Resources Association Conference in November 2019 as part of the poster showcase. To view the entire poster presentation, click here.