Courses: The GoldSim Contaminant Transport Module:
Unit 11 - Using Features of the RT Module: Modeling Complex Source Terms
Lesson 6 – Modeling Transport of Exposed Mass from a Source Using Source Cells
In the previous two Lessons we looked at two Examples (with the second one building on the first). In the second Example, we simulated a single drum (with a single barrier) that contained three species. The mass inside the drum was assumed to be contained within a matrix (e.g., grout) such that when the wall of the drum failed, the mass inside the drum was not immediately exposed. Instead, it was exposed gradually as the matrix material degraded.
However, the mass never moved out of the drum after exposure. But the entire purpose of a Source element is to model a source term (i.e., an input rate) to other pathway(s) in the model. So for this to happen, we need to take this Example one step further and define how mass actually leaves the Source after it is exposed. This allows us to compute a release rate from the Source (that subsequently could serve as an input rate to another pathway in the model). We will do that in this Lesson.
We define how mass actually leaves the Source after it is exposed by specifying the properties and behavior of the Associated Cell(s) inside the Source. To do so we need to carefully define what the Associated Cell(s) inside of the Source physically represent. In general terms, the Associated Cell(s) for a Source are intended to physically represent a single package within the Source. As we shall see, however, what that exactly means is up to the user.
To begin to explore how this is done, open ExampleCT32_Simple_Exposure_and_Release.gsm from the “Examples” subfolder of the “Contaminant Transport Course” folder you should have downloaded and unzipped to your Desktop.
You will see that there are four different Containers in this Example, each containing a Source (outlined in blue):
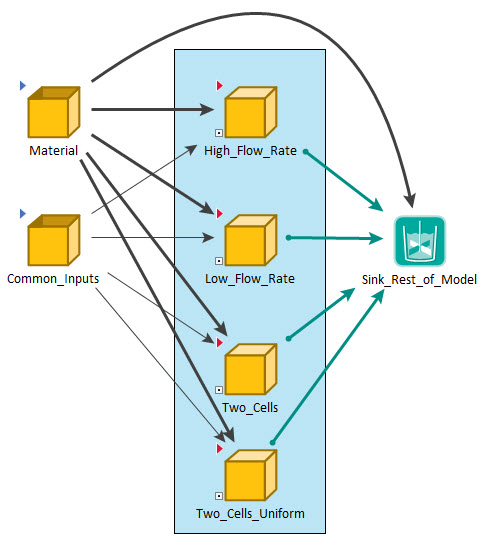
We will discuss the fourth Source (Two_Cells_Uniform) at the end of this Lesson. For now, let’s focus on the first three.
For the first three Sources (High_Flow_Rate, Low_Flow_Rate and Two_Cells), rather than failing randomly according to a uniform distribution (as was the case in previous Examples), the single package fails immediately (at the beginning of the simulation). We have done this in order to easily compare results for these three Sources. Otherwise, for any given realization, the package in the three Sources would have failed at a different random time, and this would complicate our comparison. Like in the previous Example, we consider the same three species (X, Y and Z) and the mass in each Source is contained in a matrix material that degrades over three years. Since for these Sources the package fails immediately, this means that the matrix starts to degrade immediately, and does so for the first three years of the simulation.
Whereas in the previous Example we did not allow mass to be transported from the Associated Cell once it was exposed, in this Example, mass does indeed leave the Cell. However, for each Source, we have a slightly different conceptual model for how it does so.
Let’s first look at the High_Flow_Rate Container. Go into this Container and enter the Source Container named Drum. You will see a single Cell (named Entire_Drum). By default the single Cell inside a Source is named Cell1; we have renamed it. Open this element:
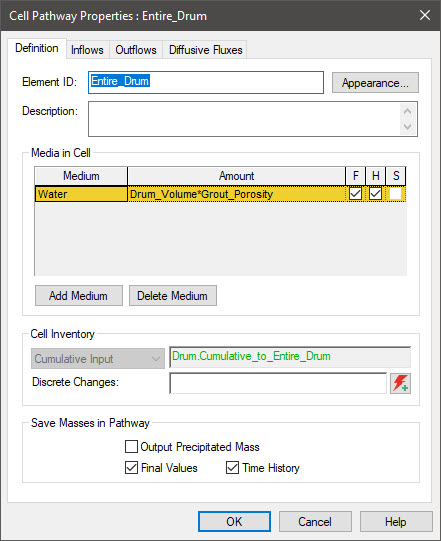
The first thing you should notice here is the Cell Inventory field. You will note that it is not editable (as it would be for other Cells) and is defined as a “Cumulative Input” with a value of Drum.Cumulative_to_Entire_Drum. This is one of the outputs directly computed by a Source (and one of the results we have looked at in previous Examples). It is the cumulative amount of exposed mass released to that Inventory Cell. This is an important point to understand about Inventory Cells. You cannot specify a Cell Inventory. It is automatically defined when you specify that the Cell is an Inventory Cell.
Once mass is exposed and placed into this Cell (in this case, gradually over the first three years), we want to specify how it is transported out of the Cell. In order to do so, we need a conceptual model for this release process. In this case, our simple conceptual model is as follows:
- The drum is sitting on its side aligned with the direction of water flow, such that once the drum fails, water moves horizontally through the “top” of the drum (a circle), exiting at the “bottom” of the drum.
- The pore space inside the drum (within the grout) is assumed to always be saturated and the porosity of the grout (and hence the volume of water inside the drum) does not change as it degrades (in reality, of course, the porosity might change as the grout degrades).
- The Associated Cell represents the interior of the drum. Because the drum is being represented using just a single Cell, all the mass in the drum is instantly well mixed (the concentration in the drum is constant throughout the drum).
Note that the volume of water in the drum is simply defined as the drum volume multiplied by the grout porosity.
Note: The drum also contains grout and degraded grout. Conceptually, once the mass is exposed when the grout degrades, it could then interact with (e.g., partition) onto the grout material. Be we have assumed this is not the case. If it were the case, we could add the grout material as a Solid in the Cell and define appropriate partition coefficients.
If you look at the Outflows for this Cell, you will see that there is an outflow from the Associated Cell to a Cell outside of the Source (which is simply acting as a sink in this simple Example). If you examine how the flow rate is defined, you will see that it is equal to the area through which the water is flowing (the area of the top of the drum) multiplied by the Darcy velocity. For this case (as indicated by the name of the Container) we have assumed a very high Darcy velocity.
Navigate out of the Source Container to the Container just above it (High_Flow_Rate) and run the model. For the purposes of this Example, there is only one Time History Result element set up to look at here, named Rates. Open it now:
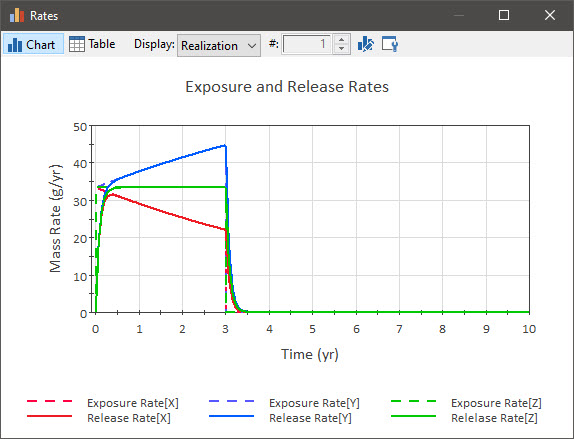
What we are plotting here is the rate at which mass is being exposed (as we did in the previous Example), as well as the rate at which mass is being released. This latter result is simply the rate at which mass is transported out of the Associated Cell (to the Cell outside the Source). This rate is actually the most important output of a Source element (it is what we are actually using the Source element to compute so you don’t have to try to specify it manually).
(Note that for clarity, the time axis has been slightly modified to start below zero).
What we see in this plot is that for any given species, the rate of exposure and rate of release are almost identical. You can see this more clearly by pressing the Edit Properties button for the chart (the furthest button to the right) and clearing the check boxes for the other results so you are only viewing the results for Z:
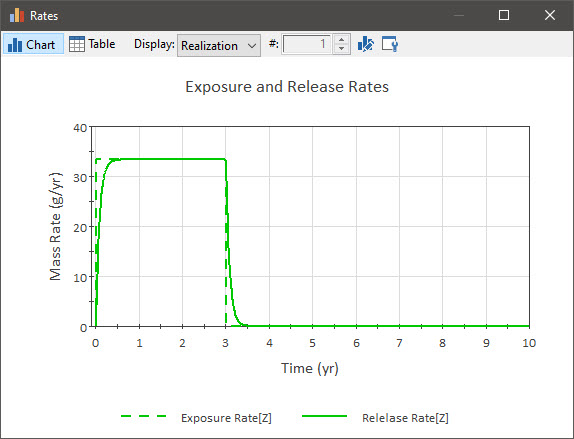
As can be seen, there is a small delayed response in the release at the beginning (time 0) and at the end (time 3 yr) of the exposure, but otherwise that rate of release is close to the rate of exposure. What does this tell us? Keep in mind that the ultimate rate of release is a function of the rate at which mass is being exposed and the rate at which it is being transferred out of the Source. What this result implies is that in this case the rate of release is almost completely controlled by the rate of exposure. That is, the mass is transferred out of the Source essentially as fast as it is being exposed.
Now navigate up and into the Low_Flow_Rate Container. The conceptual model for this Source is identical to the first Source with one exception: the Darcy velocity is 40 times lower. The Rate result looks like this:
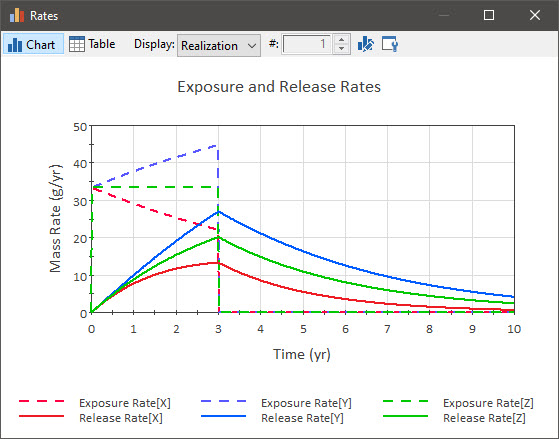
What we see here is that the exposure rate and the release rate are quite different. In this case the mass transfer rate is slow enough that it significantly impacts the release rate. That is, the release rate is controlled by both the rate of exposure and the rate of mass transfer rate out of the Source.
Next, navigate up and into the Two_Cells Container. Then go inside the Drum Container. You will see not one Associated Cell, but two:
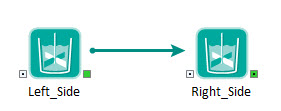
Our conceptual model here is slightly different. We are assuming that while the entire drum is still filled with grout, the contaminants are contained only in the top half of the drum. Water flows (at the low flow rate we used in the previous Source) from left to right, and flows into the top (upstream) half of the drum (where the contaminants are located), through the bottom (downstream) half of the drum, and then out of the drum completely. To model this, we now have two Associated Cells. The key point is that only one Cell (Left_Side) is an Inventory Cell (you can see this by looking at the Source element itself). This is how we specify physically where the mass is initially located.
The rate results look like this:
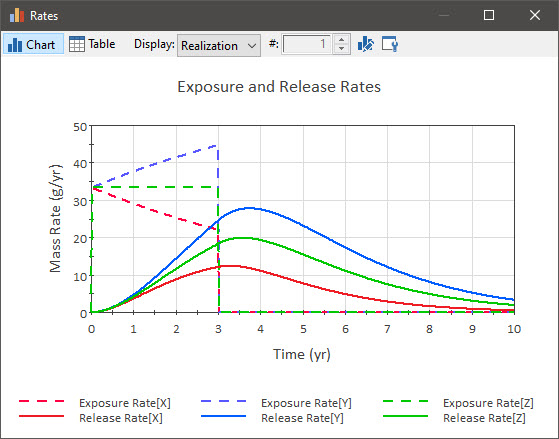
We see that the release rate is a bit different (it is smoothed and delayed) compared to the previous Source due to the fact that the mass was originally only located in the upstream half of the drum and needed to be transported through the downstream half of the drum in order to be released.
This is a simple example of how the mass transport processes in the interior of your Source can be modeled in greater detail. The key point here is that the Associated Cells represent the interior of one package (in this Example, a drum), and ultimately you want to model the transport processes inside (and ultimately out of) that package (after the mass is exposed). Eventually, one or more of those Associated Cells will pass (e.g., via an advective or diffusive mass transfer flux) the mass outside of the Source to other pathways (e.g., representing the geosphere).
Although this is a simple model (using only two Cells and considering only advection), your representation of the package interior can be quite complex (using any number of Cell pathways) and can include any of the processes we have discussed in previous Units (e.g., advection, diffusion, sorption, solubility constraints). (However, in most cases you should not use any other kinds of pathways other than Cells). In the next Lesson we will work through an Exercise with a more complex conceptual model that includes more processes than just advection.
Before leaving this Lesson, let’s look at one more Source. Navigate up and into the Two_Cells_Uniform Container. This Source is identical to the one we just looked at (in which we represented the drum using two Associated Cells). However, instead of failing the package immediately, it fails randomly according to a uniform distribution (over 10 years). So let’s run a Monte Carlo simulation. Return to Edit Mode, edit the Simulation Settings, and change # Realizations to 100. Then rerun the model.
The rate results look like this (this is the 100th realization):
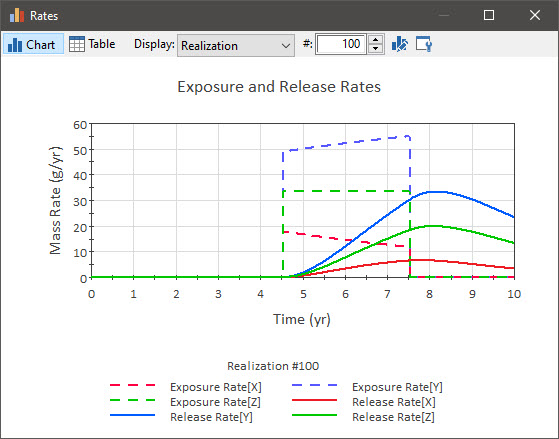
Toggle through the various realizations. The release rate varies quite widely. Based on this, it should be quite clear how powerful a Source element can be. While our conceptual model is relatively simple (a single drum that fails randomly, mass that is contained in grout that must degrade, simple advective transport out of the drum) it would be impossible for you to represent a release rate using an equation (particularly due to the processes of decay and ingrowth). To represent all of these processes realistically, you need to actually model them using the Source element.
There is one final point that it is important to discuss. If you examine the Left_Side and Right_Side Associated Cells in this Source, you will see that they both have an Outflow (Left_Side flows to Right_Side, and Right_Side flows to a Cell outside the Source). The flow rate is constant (it is defined as the area of the top of the drum multiplied by the porosity multiplied by the groundwater seepage velocity). However, we stated that prior to the failure of the drum, no water can flow through the drum. So how can we reconcile that with the constant flow rate that is specified? That is, shouldn’t the flow rate be zero prior to drum failure? In fact, it is zero prior to drum failure. The reason for this is that GoldSim treats Associated Cells in a very special way. In particular, if the package has not yet failed, the flow rate is set to zero (i.e., the specified value is ignored). It only takes on the specified value once the package has failed. We will discuss this in greater detail in Lesson 8.
