Courses: The GoldSim Contaminant Transport Module:
Unit 10 - Using Features of the RT Module: Modeling Decay Chains, Isotopes and Doses
Lesson 9 – Exercise: Computing Doses
In order to become more comfortable with using a Receptor element, in this Lesson we will work through a simple Exercise.
The model will have two species, I129 and Tc99. You should use GoldSim’s built-in database to add these two species to the model (discussed in Lesson 5). The data for these species is shown below:
| Species | Atomic Weight (g/mol) | Half-life (yr) |
|---|---|---|
| I129 | 129.905 | 1.57 E7 |
| Tc99 | 98.9063 |
2.111 E5 |
The Atomic Weight and Half-life don’t need to be specified directly, since they are provided automatically by GoldSim’s builit-in database. Both of these species decay to stable nuclides (Xe and Ru), and we will not bother to model those, so there will only be two species in the model.
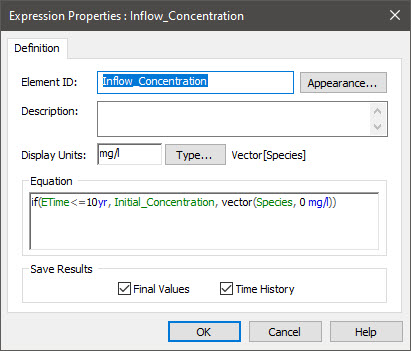
To simplify matters (so we can focus on the Receptor), we are going to assume a very simple contaminant transport model. We will consider a pond with a constant volume of 10,000 m3 and an outflow rate of 500 m3/yr. The pond also has a constant inflow rate of 500 m3/yr. For the first 10 years of the simulation, there are fixed concentrations of I129 and Tc99 in the inflow of 1E-5 mg/l and 5E-6 mg/l, respectively. After 10 years, the concentrations in the inflow are zero.
Our receptor is a farmer who drinks 2 l/day. The dose conversion factors for this drinking water pathway are as follows:
| Species | Dose Conversion Factor (Sv/Bq) |
|---|---|
| I129 | 1.1 E-7 |
| Tc99 | 6.4 E-10 |
We want to plot the dose from each species and the total dose as a function of time, and compute the peak total dose received by the farmer over the next 20 years.
To create this model, you should start with a new model and follow these steps:
- Edit the Species element and add the two Species using GoldSim’s built-in database.
- Create Data elements for the following inputs:
- Pond volume
- Pond (inflow and outflow) rate
- Water ingestion rate
- Fixed concentration in inflow for first 10 years (a vector of species)
- Dose Conversion Factor (a vector of species)
- Create an Expression (a vector of species) that sets the concentration to the fixed concentration (item 2d above) for the first 10 years, and zero afterward.
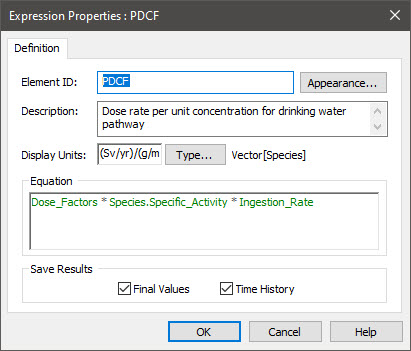
- Create an Expression (a vector of species) for the Pathway Dose Conversion Factor. This is the product of the Dose Conversion Factor (item 2e), the Specific Activity (an output of the Species element) and the ingestion rate (item 2e).
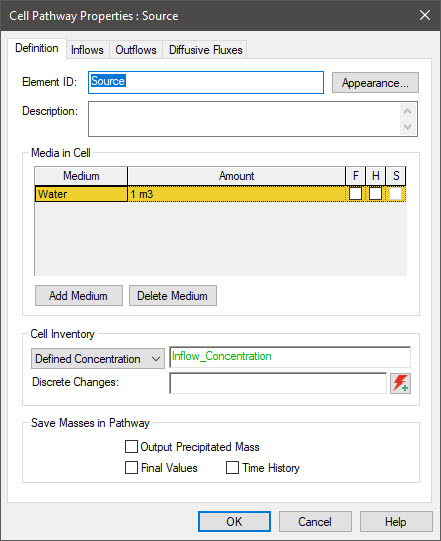
- Create a Cell (name it Source) with a volume of 1 m3 (the volume is not used). Specify it as having a “Defined Concentration” with the concentration from item 3 above.
- Create a Cell (name it Pond) with the specified volume (item 2a above).
- Create a Cell (name it Sink) with a volume of 1 m3 (the volume is not used).
- Create an advective link from Source to Pond with a flow rate as defined in item 2b.
- Create an advective link from Pond to Sink with a flow rate as defined in item 2b.
- Create a Receptor (name it Farmer). Define the Impact Type as a Dose and the Impact as the product of the Pathway Dose Conversion Factor (item 4) and the concentration in the Pond.
- Create an Expression named Total Dose that sums the items of the Receptor output.
- Create an Extrema element to compute the Peak Total Dose.
- Create a Time History Result element to plot the dose from each species and the total dose as a function of time.
- Set the Time Settings for a Duration of 20 yr and a timestep of 0.2 yr.
Stop now and try to build and run the model.
Once you are done with your model, save it to the “MyModels” subfolder of the “Contaminant Transport Course” folder on your desktop (call it ExerciseCT17.gsm). If, and only if, you get stuck, open and look at the worked out Exercise (ExerciseCT17_Receptors.gsm in the “Exercises” subfolder) to help you finish the model.
Let’s walk through this very simple model now.
The model should looks something like this:

Note that in this case, the inputs have all been placed inside a Container named Inputs, whose contents look like this:
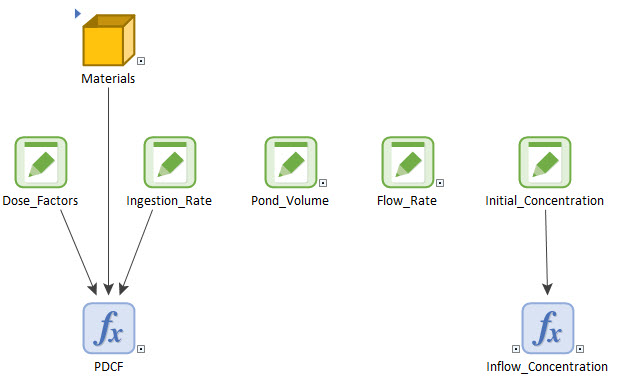
The Data elements are self-explanatory. Inside the Materials Container is the Species element, which should look like this:

The inflow concentration is simply an If statement:
The Pathway Dose Conversion Factor is a simple Expression:
Returning to the top level Container, the Source Cell should look like this:
And the Pond Cell should look like this:

Both should have advective flux links to the downstream Cell.
The Receptor should look like this:
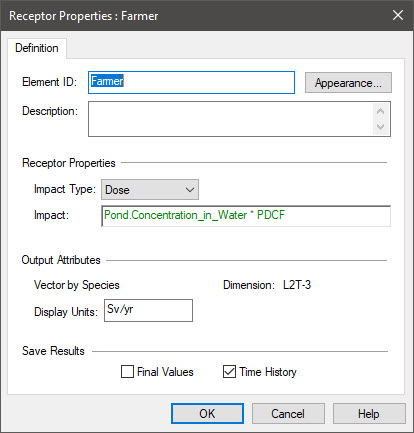
The Total Dose simply uses the sumv function on the output of the Receptor. The Extrema takes as its input the Total Dose.
One note should be made regarding the Time History Result element. If you add the vector (the output of the Receptor) and the Total Dose, you will find that the items initially look like this:
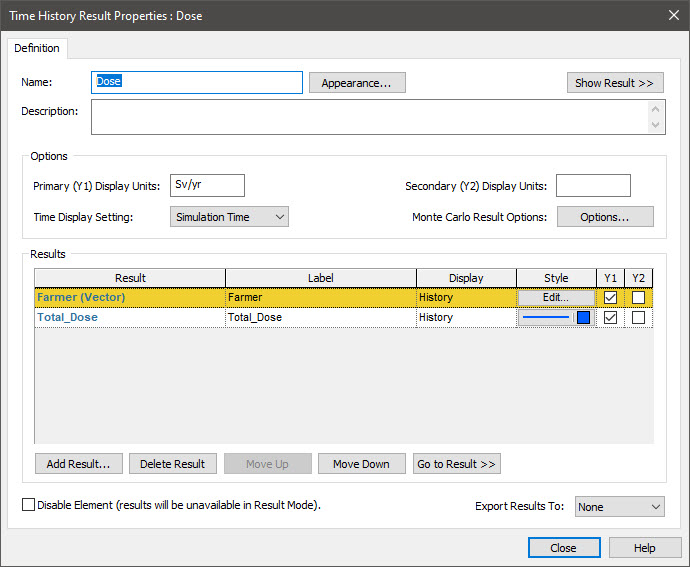
There is a vector and a scalar here. If you were to click the Edit… button next to the first item (under Style) you would note that the second item of the vector has a default color of blue. This is also the default color of the second item in the result list. We don’t want these colors to be the same, so click on the blue line under Style for the Total Dose, and change its color (e.g., to black).
If we then run the model and plot the doses, it should look like this:

We can see from this plot that the Peak Total Dose is approximately 2.6E-6 Sv/yr (and you could hold the cursor over the line to see the actual value). However, an easier way to do this is to simply hold your cursor over the Extrema element:

