Courses: Introduction to GoldSim:
Unit 8 - Representing Complex Dynamics: Feedback Loops
Lesson 5 - Representing Response Surfaces Using Lookup Table Elements
In this Lesson we are going to introduce an important new element, the Lookup Table. We are going to use the feedback loop Exercise we carried out in the last Lesson as a way to understand how you would use such an element.
You will recall that in that Exercise we assumed that the pond evaporates at a rate that is linearly proportional to the volume of water in the pond. You don’t need a background in hydrology to recognize that this is not really the most appropriate way to describe the behavior. If we really wanted to compute the evaporation rate, what we would need is not the volume of water in the pond, but the surface area of the water in the pond. The larger the surface area, the greater the evaporation rate. That is, the evaporation rate is a function of the surface area of the water in the pond, not the volume of water in the pond.
In terms of the causal loop diagram, therefore, a more refined representation of this system would look like this:
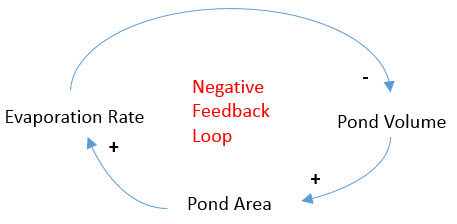
As the pond volume increases, the pond area increases; as the pond area increases, the evaporation rate increases; and as the evaporation rate increases, the pond volume decreases.
Note: Of course, theoretically, it is not necessarily the case that the surface area of a pond increases as the pond volume increases. In particular, if the pond had vertical sides (i.e., walls), the surface area would not change with pond volume. Here, however, we assume the more realistic case that the pond walls are not vertical.
We will actually build this model as an Exercise in the next Lesson, but for now let’s just focus on one aspect of the problem: in order to model such a system, we would need to be able to compute the pond area given the pond volume. How would we go about doing this? Clearly, the relationship between the pond volume and the pond area is controlled by the shape of the pond. However, unless the pond was a specific geometric shape (e.g., trapezoidal) it would not be possible write an equation that computes the surface area as a function of the volume.
If you had a map of the pond (showing its depth contours), however, with a bit of effort you could construct a table of paired values listing the area corresponding to a particular volume. If you had a sufficient number of data pairs, this would provide a fairly accurate description of the volume/area relationship. Then, for any given volume, you could use the table to “look up” the corresponding area (by either using the closest data point, or perhaps interpolating between data points). Such a table is referred to as a lookup table, or more generally (if there is more than one independent variable), a response surface. Response surfaces provide a powerful and flexible way to represent complex relationships between variables that cannot readily be expressed using equations.
GoldSim has a specialized element for creating response surfaces called a Lookup Table element.
In order to understand the Lookup Table, let’s start with a new model, and insert a Lookup Table element (you will find it in the “Inputs” category):
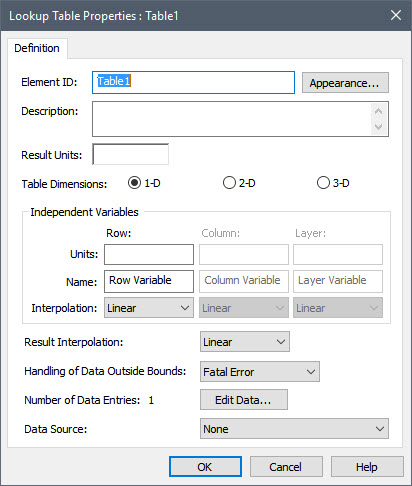
Let’s name this element “Area_from_Volume”. The Table Dimensions is where you specify how many independent variables the Lookup Table has (there are three options: 1-D, 2-D or 3-D). In our case, we want to create a 1-D table (there is a single independent variable, the volume). We will next need to specify two sets of units. The Result Units are the units for the dependent variable (i.e., what we want to compute). In this case, it is the surface area, so we will assign units of m2. For a 1-D table, we then need to assign the units for the independent variable (labeled as the Row units). In this case, it is a volume, so we will assign units of m3. We can also assign a Name to the independent variable; this appears in the table we will view (and edit) shortly to make it clear what that data we are entering represents. This defaults to simply “Row Variable”. Let’s change this to “Volume”.
After we do this, we can define the table itself. To do so, press the Edit Data button. The following dialog will be displayed:
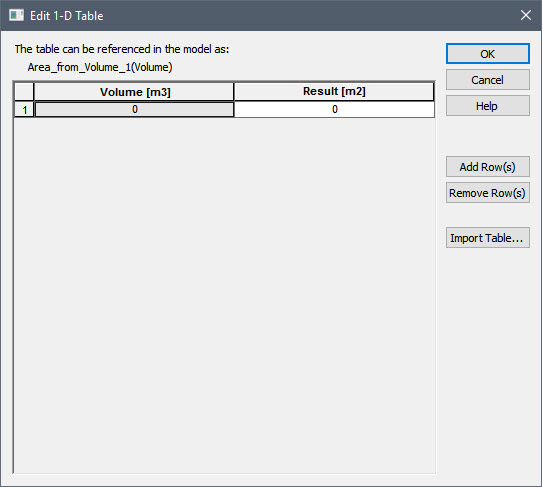
By default, the table is created with a single row of zeros. Note that the Name we entered (“Volume”) appears in the header for the first column (the independent variable).
You add rows to the table using the Add Row(s) button. If you hold down the Ctrl key when you press this button, you will be prompted for the number of rows to add (otherwise, a single row will be added). To delete one or more rows, select them and press the Remove Row(s) button.
The first column of the table is where you enter the values for the independent (row) variable; the second column is where you enter the values for the dependent variable (the result).
The fields in the table only accept numbers (they do not accept links to other elements). You should not append units to the numbers. The assumed units for the values that you enter are the units specified for the two variables on the main Lookup Table dialog. These units are displayed in the column headers.
Note: In addition to entering data by hand, you can paste data from a spreadsheet, Word document or coma-delimited text file. You can also import data from a specifically formatted text file, a spreadsheet, or a database. The details of doing so are described in GoldSim Help.
The values of the Row Variable must increase monotonically as you move downward in the table. When you press OK to close the dialog, GoldSim automatically sorts the rows into the correct order, and also deletes all empty rows.
For now, let’s just enter 6 data pairs:
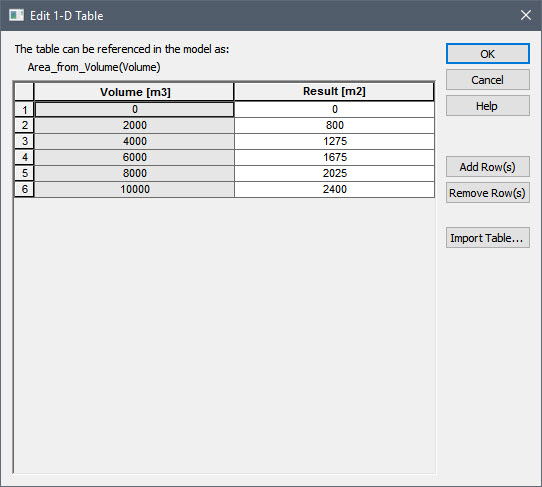
In order to actually use the table, we need to discuss two additional points: interpolation and extrapolation. If you look at the main dialog again, you will note that there are two fields for specifying how we will interpolate into the table; since there are two columns of data (independent variable and dependent variable), we can specify interpolation for both. You can read about the various interpolation options in GoldSim Help, but in most cases, linear interpolation will be fine (which is the default). To understand what this implies, take a look at the data again (above). If the volume was 3000 m3, GoldSim would linearly interpolate into the table to return 1037.5 m2 for the area (halfway between 800 m2 and 1275 m2).
What would happen if the volume was specified as 15000 m3? What area would GoldSim return? As you can see from the table, this data point is actually outside the range of data provided. The field labeled Handling of Data Outside Bounds controls how GoldSim treats this situation. The default is that GoldSim would return a fatal error (and it is strongly recommended that you stay with this option). However, other options instruct GoldSim to extrapolate (using the last two data points), or hold the value at the “edge” of the table (e.g., returning an area of 2400 m2 for any volume that exceeds 10000 m3).
So now that we have created a Lookup Table, how do we actually reference it? Lookup Table elements are unique in that you don’t reference them in the same manner that you reference the outputs of other elements. Instead, you reference them in the way that you would reference a built-in function (like sin or log). That is, once you define a table, you reference it in input expressions for other elements as if it were a custom function. For our example, in order to reference the table, we would create an Expression that looked like this:
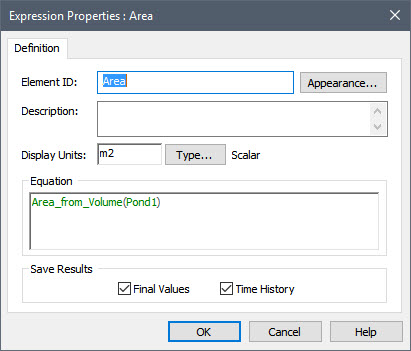
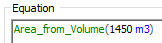
This is referred to as table function. This expression instructs GoldSim to use the 1-D lookup table defined by the element “Area_from_Volume” and compute an output value based on a value for the row variable equal to “Pond1” (in this example, Pond1 could be a Pool element that computes the volume). The argument can be a link to an output, or you could type in a value directly:
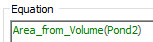
Of course, once you have defined the table, you can reference it at multiple locations (i.e., in the input fields for various elements) using different input arguments in the same manner as you would use the built-in functions provided by GoldSim multiple times. For example, if two ponds had exactly the same shape (i.e., the same response surface), elsewhere in the model you could reference the table using the volume for a different pond:
The argument(s) to a table function must have dimensions that are the same as those of the independent variables with which the Lookup Table was originally defined. Hence, in the example above, if you referenced the table as Area_from_Volume(100 m), GoldSim would produce an error message, since based on the way that Area_from_Volume was defined, the argument must have dimensions of volume, not length.
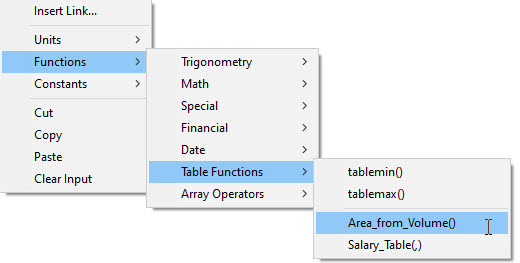
Note that because Lookup Tables can be thought of as “custom functions”, when you create a Lookup Table, GoldSim automatically lists the table function in the Function menu (mentioned in Unit 5, Lesson 5) that is accessible from the context menu within an input field:
In the discussion above, we focused on 1-D Lookup tables. However, GoldSim allows you to create 2-D and 3-D Lookup Tables also. For example, suppose that the salary of someone was a function of their age and years of post-secondary school education. We could create a Lookup Table for this as follows:
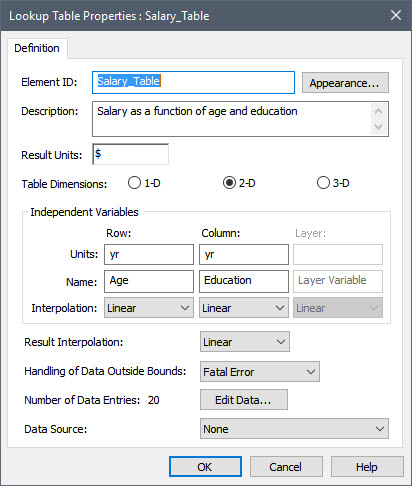
The data would consist of a 2-D array of values:
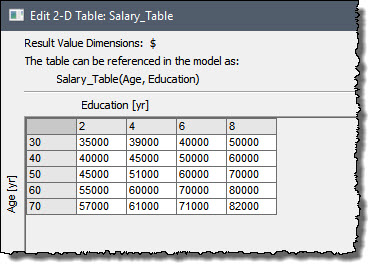
For any given age (row) and years of education (column), GoldSim would interpolate into the table (a true response surface in this case), to return a salary. Obviously, when you reference such a table, you would need to send it two arguments (separated by commas).