Courses: Introduction to GoldSim:
Unit 9 - Representing Complex Dynamics: Delays
Lesson 5 - Exercise: Handling Recirculating (Recursive) Logic
Before completing this Unit, we are going to explore one further (and very important) use for Material Delays: handling recirculating (recursive) logic. This is best illustrated by working through another Exercise.
We will build a new model consisting of two ponds (represented using Pools). The first pond (Pond1) has an initial volume (Initial Quantity) of 1000 m3 and a single Outflow Request (due to pumping) of 10 m3/day. The second pond (Pond2) accepts the Outflow output from Pond1 and has an Upper Bound of 400 m3. Note that Because Pond2 has an Upper Bound, it has an Overflow output. What we would like to do is route the overflow from Pond2 back into Pond1 (as an Inflow), hence creating a recirculating system: water is pumped from Pond1 into Pond2, and when Pond2 overflows, it is directed back into Pond1.
Stop now and try to build the model, but don’t yet route the overflow from Pond2 back to Pond1.
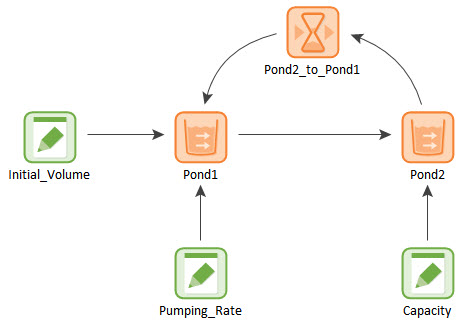
Before you try to route the Overflow output from Pond2 back as an Inflow to Pond1, the model structure should look something like this:

Now try to route the Overflow from Pond2 to an Inflow for Pond1. You will see that GoldSim will display an error message:
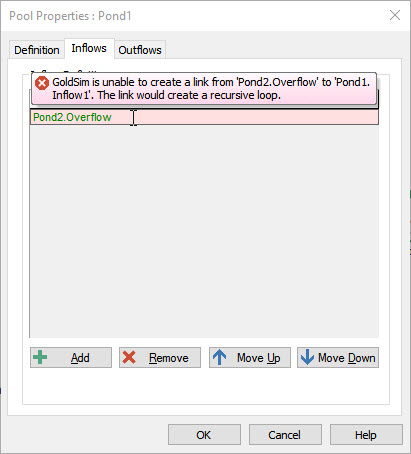
So what is happening here?
GoldSim reports that it is unable to create this link, as doing so would create a recursive loop. But why is this the case? Previously in this Unit we created looping systems that looked very similar to this. However, there is an important difference here. We noted previously (in Unit 8, Lesson 3) that GoldSim allows you to create looping systems like this if and only if the following requirement is met: the loop must contain a state variable. But in this case, there are no state variables involved. Although the loop involves two Pools (and the primary output of a Pool is a state variable), in this model the actual outputs being referenced are not state variables (neither the Outflow output nor the Overflow output is a state variable.) This prevents us from “closing the loop”.
Fortunately, we can address this by inserting a Material Delay element into this loop. In particular, we can define the Overflow from Pond2 as the input to a Material Delay:
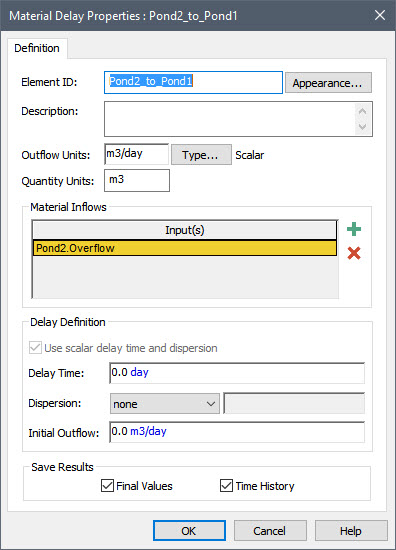
We can then define the output for the Material Delay as the Inflow to Pond1, thereby closing the loop:
But what does this mean physically? It simply means that when water overflows from Pond2 it does not enter Pond1 immediately. There is a delay while it is transported there. In fact, we could also add a Material Delay between Pond1 and Pond2, as there is likely some kind of delay there also. What is the appropriate delay time to enter into the Material Delay? If we leave it at zero, GoldSim will use the timestep length as the delay time (material cannot move through a Material Delay in less than a timestep). Doing so would be appropriate if the actual travel time was quite short. If the travel time is greater than a timestep, the actual travel time should be entered.
It turns out that in many engineered systems (e.g., mines, power plants, chemical plants) material is recirculated in this manner, so the ability of Material Delays to “close the loop” can be a valuable tool. Of course, in the real world, there is always a delay in moving material from one location to another, so conceptually, there should always be Material Delays throughout a model that is trying to represent such a system. Practically, however, the transit time may often be short compared to the computational timestep of your model, and that is why Material Delays are often omitted (causing recursive errors). Of course, as illustrated in this Exercise, to model a recirculating system, at least one of these delays will need to be implemented in the model as a Material Delay to close the loop. If the actual transit time is significantly smaller than the computational timestep (the shortest possible transit time for a Material Delay), this would introduce a slight error in the model. In most cases, the impact of such an error will be small and unnoticeable. In the rare case where this error becomes significant, it would be necessary to shorten the timestep.
If you have not already done so, make the changes discussed above and once you are done with your model, save it to the “MyModels” subfolder of the “Basic GoldSim Course” folder on your desktop (call it Exercise10.gsm). If necessary, you can open and look at the worked out Exercise (Exercise10_Recirculation.gsm in the “Exercises” subfolder) to help you finish the model.