Courses: Introduction to GoldSim:
Unit 3 - Exploring and Running a Simple Model
Lesson 8 - Viewing Results
Let’s now view some results.
There are two ways to view results in GoldSim:
- You can view the results of any element by right-clicking on the specific element you wish to view and selecting a result type. For example, if you right-click on Inflow_Rate (while in Result Mode), the following context menu is displayed:
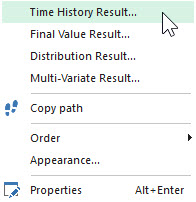
You could then select (i.e., left-click on) Time History Result… to view a time history display, Final Value Result... to view a display of final values (e.g., as a bar, column or pie chart), Distribution Result… to view a distribution, or Multi-variate Result… to view a scatter plot or other multi-variate display. In this simple example, the latter three results types are not of interest (we will discuss all of them in later Units), so let’s view a time history result. It will look like this: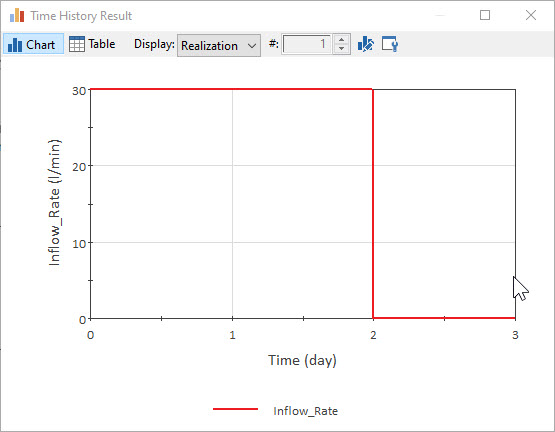
This is a very simple time history, indicating that the hose was on (flowing at a rate of 30 liters/min) for 2 days, and then was turned off.
You can close the window by clicking on the X in the upper right hand corner of the window.Note: Although we don't have to be concerned about this for the current example, it is worth pointing out here that many GoldSim elements have more than one output. In this case, right-clicking on the element and selecting a result option displays the result of the primary output (the one you are most likely to be interested in). We will discuss how to look at the secondary outputs of an element in a subsequent Unit.
- The second way to view results is to use Result elements. Result elements are special elements that you can insert into a model that allow you to easily view and format results. There is one Result element in the example model: Tank Volume. This Result element is actually set up to display the output of the Tank element. Double-click on Tank Volume:
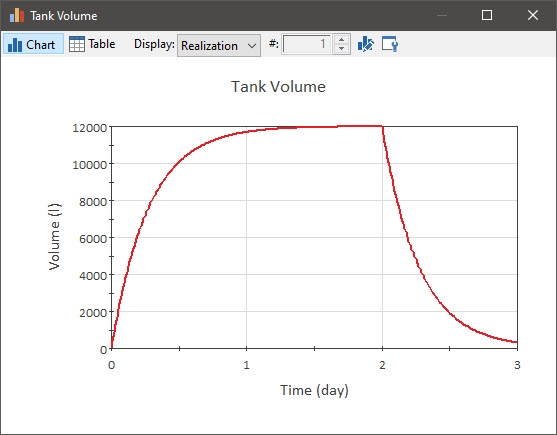
Here we see that the tank fills up (and reaches a steady value) over the first two days, and after we turn off the hose is nearly empty again by 3 days (since the tank leaks).
You can also view time history results in table form by clicking the Table button at the top of the window:
The results table view look like this: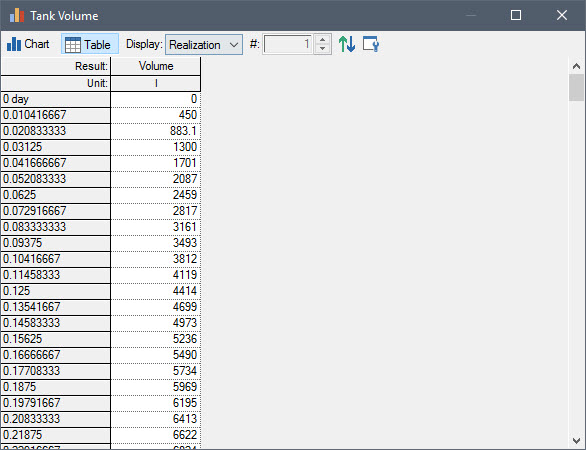
You can return to the chart view by clicking the Chart button:
Again, you can close the window by clicking on the X in the upper right hand corner of the window.
Note that when a model is in Result Mode, we cannot make changes to the structure or inputs of the model. To change a model in a way that may affect results, you must be in Edit Mode. Returning to Edit Mode erases all results (so that the results always reflect the current state of the model). Let's return to Edit Mode now.
You can do so by clicking the Edit Mode button in the GoldSim toolbar:
You can also return to Edit Mode by selecting Run | Return to Edit Mode from the main menu, or by pressing F4.
After doing so, the following dialog will be displayed:

There are two choices here, but the default choice is to “Delete all results and return to Edit Mode”. Accept the default choice by selecting OK. (We will discuss the second choice in Unit 15).