Courses: Introduction to GoldSim:
Unit 5 - Understanding and Working with Elements
Lesson 8 - Understanding Influences
When you create a link between elements (as you did in Exercise1 in which you linked three Data elements to an Expression), GoldSim draws an arrow between the elements in order to graphically indicate that the elements are linked:
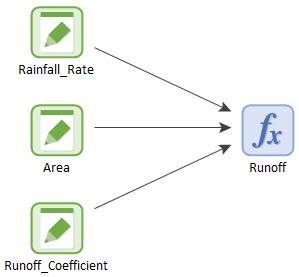
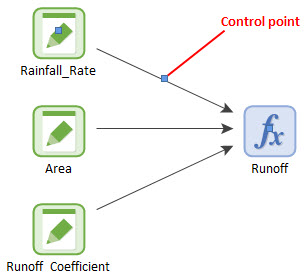
These arrows are referred to as influences. In this example, they simply indicate that Runoff is influenced by (i.e., is a function of) Rainfall_Rate, Area and Runoff_Coefficient. By default, influences are curved lines (although they are drawn with no curvature). If you select (left-click on) the influence, you will see that it has a control point in the center:
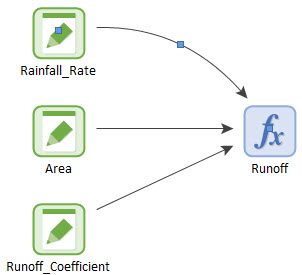
You can add curvature to the influence by selecting it and dragging the control point with your cursor:
You can modify the appearance of influences in other ways also, such as changing their color and thickness, changing their shape (forcing straight or orthogonal lines), adding nodes to segment lines, and adding text.
Note: By default, the color of an influence is a function of the type of information it is carrying. Influences representing values are black. As we shall see in subsequent Units, influences representing other kinds of information (e.g., conditions or discrete events) are other colors (e.g., green or red).
As we will discuss in Unit 16, in some instances, in order to simplify the appearance of the graphics pane, you may want to hide some or all of the influences. This is referred to as filtering the influences.