Courses: Introduction to GoldSim:
Unit 6 - Carrying Out a Dynamic Simulation
Lesson 8 - Running a Model and Viewing Results
Before we can run the model we created in the last Lesson, there is one more thing we need to do: define the Simulation Settings. In particular, we need to define the Duration and the timestep length (Basic Step). Recall that we can open the Simulation Settings dialog by pressing F2:
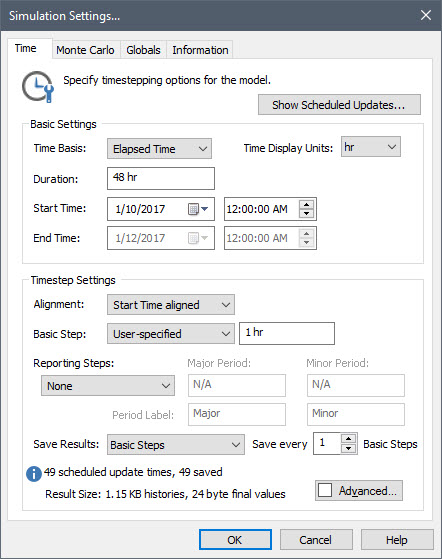
In the definition for this Exercise, we said we wanted to compute the volume of water that runs off over a 48 hour period. Hence, the Duration is set to 48 hr.
What is the proper timestep? We noted in a previous Lesson (Unit 6, Lesson 3) that the appropriate timestep length is a function of how rapidly the system represented by your model is changing: the more rapidly it is changing, the shorter the timestep required to accurately model the system. In this model, although we will see that the volume changes (it accumulates), the runoff rate itself is constant. As a result, this model could actually have a single timestep (48 hours long) and still get the correct answer (at 48 hours). However, in more complex models rates would likely be changing with time. For now, we will simply set the timestep to something much shorter, such as 1 hr.
Finally, we may want to change the Time Display Units (although we don’t have to). This will determine how the x-axis is labeled when we plot a time history result. They default to day, and this would be fine for this model. In the example above, however, it has been set to hr.
We are now ready to run the model. We do so by pressing F5 or the Run button on the toolbar:

Go ahead and do that now. When you do so, GoldSim checks to make sure the model is ready and immediately starts running.
When the simulation finishes running, a “Simulation Complete!” message is displayed. (For this simple model, this takes a fraction of a second). You can click OK to close the message.
Note: For complex models, it can take substantially longer for a simulation to complete. In these situations, the status of the simulation is indicated in the status bar at the bottom of the GoldSim window. Moreover, the Run Control toolbar has buttons that allow you to pause and restart the simulation, as well as step through the simulation one timestep at a time (with the simulation pausing between timesteps). While paused, you can view the results and explore the model. Among other things, this can be valuable for debugging a model.
Prior to running the model, GoldSim was in Edit Mode. After running it, it is placed into Result Mode. While it was running (which was for a fraction of a second in this case), it was in Run Mode. A model's current mode is always displayed in the status bar. In particular, when a model is in Edit Mode, the status bar will be blue and the word “Editing” will appear in the left-hand corner:

When the model is in Run Mode (probably too quick to notice in this case), the status bar is pink. When the model is in Result Mode, the status bar is green and the word “Results” will appear in the left-hand corner:

Note: A fourth mode (Scenario Mode) also exists if you choose to use GoldSim’s scenario modeling feature. We will discuss this in a subsequent Unit.
Now that the model is in Result Mode, open one of the elements (e.g., the Reservoir) and try to edit it. You will immediately notice that you cannot do so. This is because that while a model is in Result Mode, we cannot make changes to the model that could affect the results (although you can change some things such as adding documentation or pictures to the graphics pane). That is, since the model has results, GoldSim cannot allow you to make any changes that would make the inputs/model structure inconsistent with the stored results (produced using the original inputs/model structure); the results must always reflect the current state of the model. To change a model in a way that may affect results, you must be in Edit Mode. Returning to Edit Mode erases all results.
Let's return to Edit Mode now. You can do so by clicking the Edit Mode button in the GoldSim toolbar:

You can also return to edit mode by selecting Run | Return to Edit Mode from the main menu, or by pressing F4.
After doing so, accept the default choice in the dialog that is displayed to “Delete all results and return to Edit Mode” and select OK. (We will discuss the second choice in the dialog in Unit 15).
Note that the model indicates in the lower-left hand corner of the GoldSim window that it is back in Edit Mode (and the status bar is blue), and you can now edit the element.
Now run the model again (by pressing F5) so we can view the results of the simulation.
Before we look at the results, however, let’s first discuss how GoldSim decides which results to save. Within GoldSim, there are two fundamental types of results:
- Final Value Results: These are primarily of interest when viewing results involving multiple realizations, and allow you to display probability distributions and multi-variate results (e.g., scatter plots). By default, “Final Value” type results are only available at the final time point in the simulation.
- Time History Results: These are saved at selected timesteps (by default, all of them), and allow you to display how an output changes as a function of time.
All element property dialogs have check boxes (at the bottom of the dialog) to specify whether output(s) of the element are to be saved:

You can save the Final Values (the values at the end of each realization in the simulation) and/or Time History (the value at selected timesteps throughout the simulation):
By default, when you create a new scalar element, the Save Results checkboxes will be checked (on). The Final Values checkbox always controls whether Final Value results are saved. However, the Time History checkbox can be overridden. In particular, as we shall see in a subsequent Unit, Time History results for multiple realization (Monte Carlo) runs are only saved under certain circumstances.
We have noted in previous Units (and you may have noticed) that in some cases small boxes appear on one or in some cases, both sides of an element. These are referred to as ports. The port on the left is the input port and the one on the right is the output port. We will discuss ports in more detail subsequently, but for now, it is sufficient to note that when in Result Mode, the element output ports in the graphics pane will be green for those elements that have saved results:
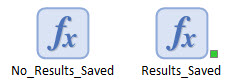
In addition, when in Result Mode, elements with saved results will be bold in the browser.
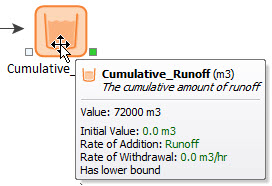
In Result Mode, for elements that have a primary output (all the elements in this Exercise), the last Value (the final value at the end of the last realization) will be displayed in a tool-tip when the cursor is held over it. (We will discuss in detail what we mean by a primary output in a subsequent Lesson). Hence, if you simply hold your cursor over the Reservoir now, you will see the cumulative volume that ran off over the 48 hour period (i.e., the Final Value calculated in the simulation):
Although the Final Value result may be of interest in a simple model like this, in real models, you will be interested in the viewing the time history of a result (i.e., seeing how it changes with time over the simulation). Right-clicking on the Reservoir element will provide a context menu for displaying such results:
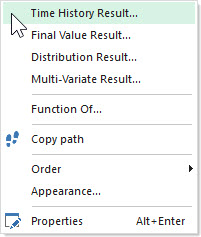
Selecting (left-clicking) Time History Result… will then display a time history chart:
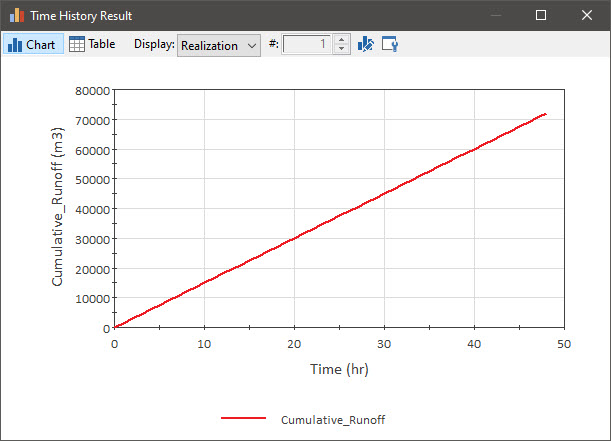
This shows that in this simple model, the cumulative volume of water that runs off increases linearly over the 48 hour period.
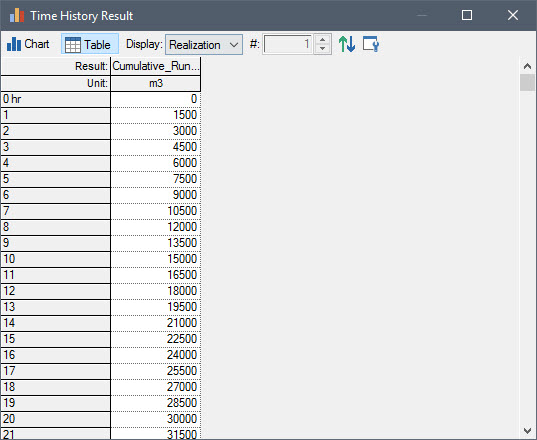
You can also view time history results in table form by clicking the Table button at the top of the window:

The results table view look like this:
You can return to the chart view by clicking the Chart button:

GoldSim provides a wide variety of tools for formatting charts. We will discuss some of those options at the end of this Unit.
You can now close the window by clicking on the X in the upper right hand corner of the window. Press F4 to return the model to Edit Mode. Then save it to the “MyModels” subfolder of the “Basic GoldSim Course” folder on your desktop (as Exercise2.gsm), as we will build upon this model in the next Lesson.