Courses: Introduction to GoldSim:
Unit 7 - Modeling Material Flows
Lesson 4 - Timestepping Details: Understanding Unscheduled Timesteps
Before proceeding, we need to take a few moments to revisit how GoldSim steps through time. This Lesson is a bit complicated and will require your careful attention, but it is critical that you understand these concepts in order to properly interpret model results.
In the Exercise we built and ran in the previous Lesson, we saw that the Reservoir started to overflow when it reached the Upper Bound. You should have saved that model and named it Exercise4.gsm. Open the model now. (If you failed to save that model, you can find the Exercise, named Exercise4_Overflow.gsm, in the “Exercises” subfolder of the “Basic GoldSim Course” folder you should have downloaded and unzipped to your Desktop.)
If you run the model and look at the Time History Result, you will note that it appears that the pond starts to overflow at 34 days. But is that really when it started to overflow?
Actually, that is not when it started to overflow. Knowing the initial volume and the flow rate, you can easily compute by hand when the volume would reach the upper bound. And it turns out that it actually reaches the upper bound at 33.8 days. This is between GoldSim timesteps (recall we specified a 1 day timestep).
So how does GoldSim handle this? In fact, the Run Log that we viewed in the last Lesson told us exactly how GoldSim handled this:
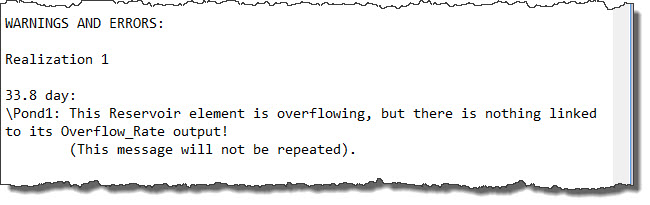
The Run Log indicates that the Reservoir started overflowing at 33.8 days. But how could GoldSim know this? We specified a 1 day timestep, which means that GoldSim only updates its calculations every day. Yet it appears that GoldSim did a calculation at 33.8 days. What is happening here?
In order to understand this, we need to take a closer look at how GoldSim steps through time.
As we discussed in a previous Lesson (Unit 6, Lesson 3), GoldSim steps through time in discrete intervals referred to as timesteps. Calculations (referred to as updates of the model) are carried out at the end of every timestep. Hence, although the term timestep actually refers to an interval of time, it is often used interchangeably with the term update (indicating a calculation at a point in time).
In GoldSim, there are actually two kinds of updates/timesteps: scheduled updates and unscheduled updates.
What we have discussed previously are scheduled updates. They are referred to as being “scheduled” because they are directly specified prior to running the model. That is, you tell GoldSim when you want these updates to occur. In our previous models, we have done this by specifying a Duration and a Basic Step. This is the most common way to specify scheduled updates, but there are actually other ways to do so also (and we will discuss one of these, Reporting Periods, in a subsequent Unit). They key point, however, is that we know when scheduled updates will occur prior to running the model. In fact, we can actually see a display of the scheduled updates before we run the model. To see this, let’s look at the Exercise from the previous Lesson. Open the Simulation Settings dialog (by pressing F2). In the top right-hand corner of the Time tab of the dialog, you will see a button labeled Show Scheduled Updates…. If you press this button, you will see a list of the scheduled updates:
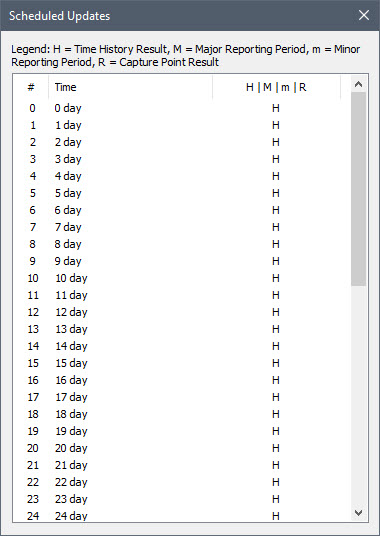
So this is a list of when GoldSim will update the model.
In some cases, however, certain events may occur between scheduled updates of the model, and waiting for the next scheduled update to update the model could decrease the accuracy of the simulation. Such events trigger what is referred to as an unscheduled update of the model. Unscheduled updates are updates that are dynamically inserted “on the fly” by GoldSim during the simulation in order to more accurately simulate the system. That is, they are not specified directly prior to running the model (as it is not possible to know when they will occur until the model is run). GoldSim inserts them automatically (and, generally, without you needing to be aware of it). There are a number of events that can trigger an unscheduled update to occur. One of the most common of these is a Reservoir (or Pool) hitting an upper or lower bound.
A key and important difference between scheduled updates and unscheduled updates is that by default, scheduled updates are included in time history plots and tables. Unscheduled updates, however, do not appear in time history plots and tables. That is, although these updates may affect the results (e.g., by making them more accurate at the scheduled update times), unscheduled updates of the model are not saved and plotted. Only the scheduled updates are actually saved and plotted.
We can see this by viewing the Time History Result element we created in the previous Exercise. After running the model, double-click on the Result element. Rather than viewing the chart, we wish to view a table of results, so press the Display Data Table button:

In the table, scroll down to the point where the pond starts to overflow:
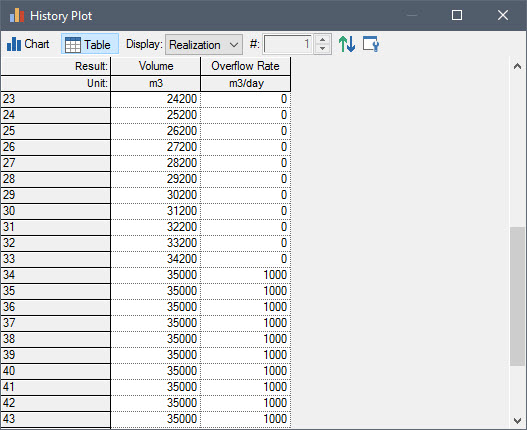
As can be seen, the overflow rate is zero at 33 days, and jumps to 1000 m3/day at 34 days. Nothing is recorded at 33.8 days. So although GoldSim inserted an unscheduled update at 33.8 days, you can’t see it here. (We’ll discuss how you can view it shortly).
For the most part, you don’t need to be aware of these updates; GoldSim carries them out “silently” in order to more accurately simulate the system. However, their possible presence brings up two critical points that you must be aware of:
- You should never assume that the timestep length is constant. It might actually change (shorten) during the simulation (due to unscheduled updates that you are unaware of). In a well-constructed model, this generally is not a problem, but some people may be in the habit of referencing the timestep length in their equations. This is particularly common for people who are used to building dynamic models in a spreadsheet (where each row represents a timestep, and the timestep length is therefore inherently constant). As a general rule, you should rarely, if ever, reference the timestep length in a simulation, as it is simply an artifact of the solution method, and has no real physical significance. If you must reference it, you should do so by referencing the Run Property named “TimestepLength”.
- It is important to understand that the value of an output reported at a particular time represents the instantaneous value at that point in time, and does not represent the average value over the timestep. Again, people who are used to building models in a spreadsheet may tend to assume that the value being output is the average value over a timestep (as this is what a computed rate would be in a spreadsheet model). In GoldSim, the value that is output is the instantaneous value at that point in time.
This second point is apparent from looking again at the table we viewed above. The overflow rate at 34 days does not represent the average overflow rate over the previous day (since we know that it actually did not start overflowing until 33.8 days). It represents the instantaneous value at exactly 34 days. It is important to understand, however, that even though GoldSim only reports instantaneous values at each scheduled timestep, GoldSim correctly captured the fact that the overflow did not begin until 33.8 days (because GoldSim “silently” inserted a timestep at that time).
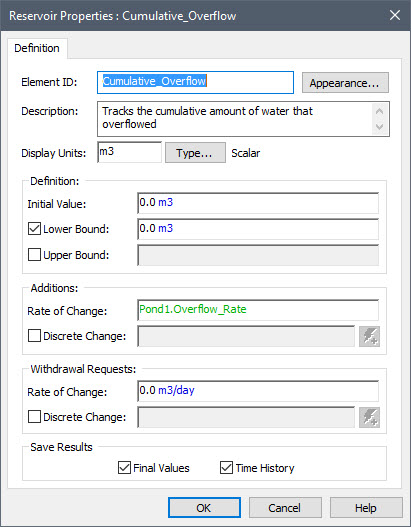
There are several ways we can actually see the impact of the unscheduled update that was inserted. The easiest way is to create a second Reservoir (named Cumulative_Overflow). Let’s route the overflow from the pond to this Reservoir (you will need to return to Edit Mode before adding this new element):
Let’s now re-run the model, right-click on the Cumulative_Overflow Reservoir, and view the Table (as opposed to Chart) of the results. Scroll down to the point when it first receives water:
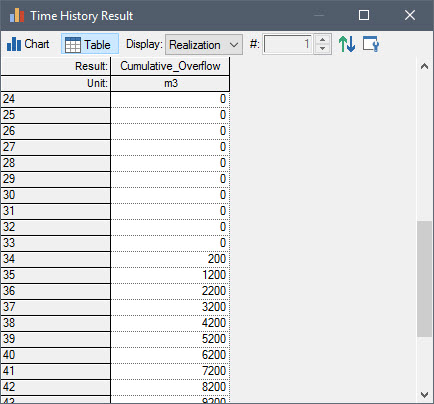
Once the Reservoir starts to overflow, it overflows at a rate of 1000 m3/day (which is the inflow rate). Accordingly, if you look at the cumulative amount of overflow at 35, 36, and 37 days, it is incremented by 1000 m3. Note, however, that the cumulative overflow at 34 days is only 200 m3. This is because starting at 33.8 days, the Reservoir started to overflow at a rate of 1000 m3/day. By 34 days, it had overflowed at that rate for 0.2 days. Hence, the cumulative overflow at 34 days is correctly reported as 200 m3.
There is another way to see the impact of the unscheduled updates. There is an option (primarily used when debugging models) that instructs GoldSim to plot the unscheduled updates. Return to Edit Mode, and open the Simulation Settings dialog (F2). Then press the Advanced… button in the lower right-hand corner of the dialog. The following dialog will be displayed:
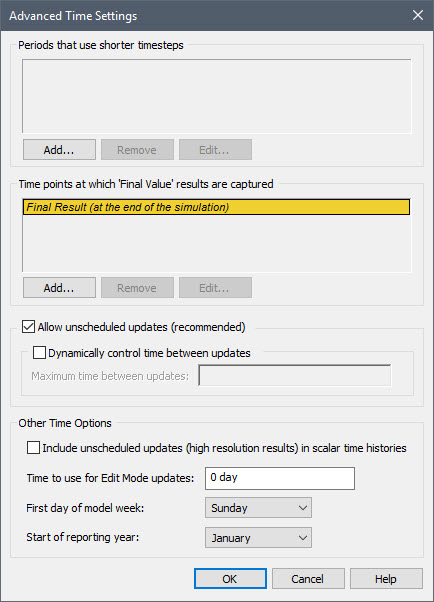
Check the box to Include unscheduled updates (high resolution results) in scalar time histories. Press OK twice, and re-run the model. Now double-click on the Result element that plots the volume and overflow rate from the pond. Scroll down to bottom of the table:
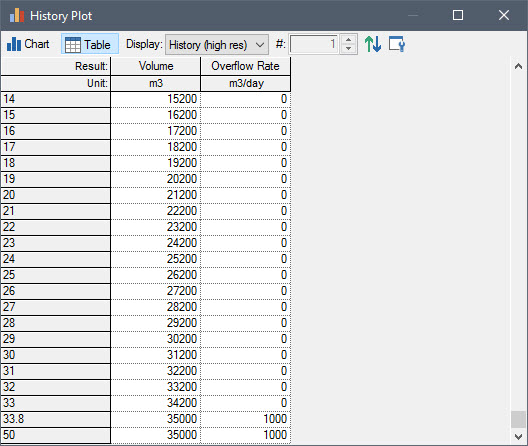
Note that you can now see a plot point at 33.8 days. You will also note that there is only one other point after this (at 50 days). This is because when plotting “high resolution” results (i.e., results that include unscheduled updates), to reduce storage requirements, GoldSim does not save every update. Rather, it only saves results that are required to provide an accurate chart display (i.e., it does not need to save data points where the value is unchanged from the previous update).
Finally, you may have noticed when looking at the Advanced Time Settings dialog that there is an option to Allow unscheduled updates (recommended). By default this is checked on. That is, by default, GoldSim inserts unscheduled updates, but you can choose to turn these off. Let’s do that now as it illustrates the impact of not allowing these unscheduled updates. To do so, do the following:
- Clear the box to Include unscheduled updates (high resolution results) in scalar time histories.
- Clear the box to Allow unscheduled updates.
- Press OK twice, and re-run the model.
- Now double-click on the Result element that plots the volume and overflow rate from the pond. Scroll down to the point when it first receives water:
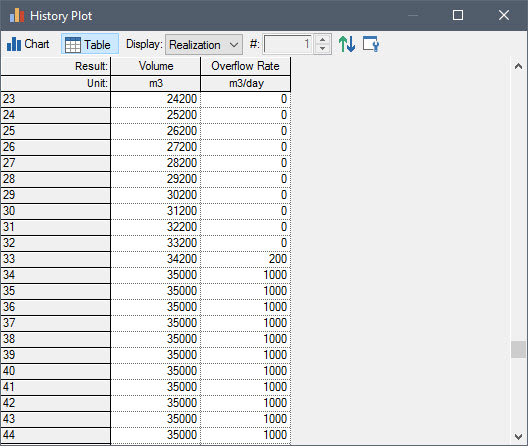
In this case, GoldSim still conserves the water (if you look at a time history of the Cumulative_Overflow, the result is identical to that when unscheduled updates are allowed). As seen above, however, in order to do so GoldSim reports an overflow rate of 200 m3/day at 33 days. This is a bit misleading in two ways: 1) the actual instantaneous overflow rate was never actually 200 m3/day; and 2) the overflow did not actually start until 33.8 days. In this case, because there are no unscheduled updates, you can think of the overflow rate as representing the average value over the following timestep. Of course, the Volume column certainly does not represent an average value; it represents the instantaneous Volume at that time. This is another reason why turning off unscheduled updates can be confusing and/or misleading (i.e., one type of result is best interpreted as an average value while the other is an instantaneous value). As a result, although there are some types of specialized simulations where it may be of value to turn off the unscheduled updates, as a general rule it is strongly recommended that you do not do so.
Note: As pointed out, with unscheduled updates turned on, the values of flows (and in fact all outputs) reported at a timestep represents the instantaneous value at that point in time, and do not represent average values over the timestep. In some cases, however, you may indeed be interested in viewing and plotting the average values of a flow over some time period (e.g., daily, monthly). GoldSim does provide a way to do this (using a feature referred to as Reporting Periods), which we will discuss in a subsequent Unit.
Before concluding this Lesson, let’s change this file back to its original state: return to Edit Mode and 1) open the Advanced Time settings and make sure that the Allow unscheduled updates (recommended) is checked on and the Include unscheduled updates checkbox is cleared (checked off); and 2) delete the Cumulative_Overflow Reservoir. Then save it to the “MyModels” subfolder of the “Basic GoldSim Course” folder on your desktop (as Exercise4.gsm). We will build upon this model in a subsequent Lesson.