Courses: Introduction to GoldSim:
Unit 7 - Modeling Material Flows
Lesson 9 - Exercise: Allocating a Limited Water Supply
In this Lesson we will carry out an Exercise that uses an Allocator. For this Exercise, we are going to start with a new model.
In this Exercise, we are going to simulate a pond with the following properties:
- It has an initial volume of 250 m3.
- It has an inflow of 10 m3/day.
- It has a requested outflow of 20 m3/day.
- Two cities would like to access the outflow. Each city has a specific demand and priority:
- Trenton: 8 m3/day, high priority
- Cambridge: 10 m3/day, lower priority
We want to plot the flow supplied to each of the two cities on a single chart. To do so, you should do the following:
- Create a Data element named “Initial_Volume”. Define it as 250 m3.
- Create a Data element named “Inflow”. Define it as 10 m3/day.
- Create a Data element named “Requested_Outflow”. Define it as 20 m3/day.
- Create a Reservoir element named “Pond” and specify the Initial Value as “Initial Volume”, Addition Rate of Change as “Inflow” and Withdrawal Request Rate of Change as “Requested_Outflow”.
- Create a Data element named “Trenton_Demand”. Define it as 8 m3/day.
- Create a Data element named “Cambridge_Demand”. Define it as 10 m3/day.
- Create an Allocator element named “Route_Outflow”. The Display Units should be specified as m3/day. The Amount should be defined as the withdrawal rate from the pond (“Pond.Withdrawal_Rate”). The Allocator element should have two outputs (named “to_Trenton” and “to_Cambridge”). The Demand to the first output (with Priority 1) should be specified as “Trenton_Demand” and the Demand to the second (with Priority 2) should be specified as “Cambridge_Demand”.
- Run the model for 50 days with a 1 day timestep.
- Create a new Result element (named “Outflows”) that plots the three results from the Allocator: to_Trenton, to_Cambridge, and Unused. Change the Y-axis label from “%rlabel% %(unit)%” to “Outflows %(unit)%”.
Stop now and try to build and run the model.
Once you are done with your model, save it to the “MyModels” subfolder of the “Basic GoldSim Course” folder on your desktop (call it Exercise6.gsm). If, and only if, you get stuck, open and look at the worked out Exercise (Exercise6_Route_Outflow.gsm in the “Exercises” subfolder) to help you finish the model.
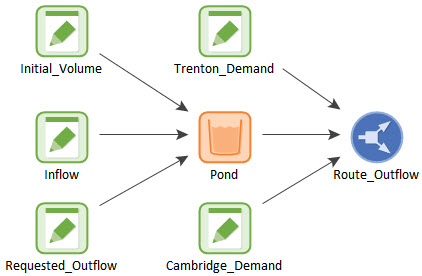
We have covered everything you need to know in previous Lessons to create this model, hence we won’t walk through it in detail here. Your model structure should look like this:
The result chart should look like this:
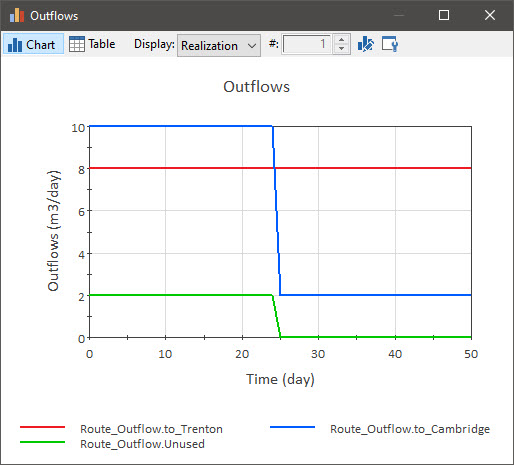
So what is happening here? Prior to 25 days, our total demand is 18 m3/day, and the outflow from the pond is 20 m3/day. So both cities receive their requested demand, and 2 m3/day of outflow is unused. At 25 days, however, the Reservoir goes empty (it started with 250 m3 and we removed a net amount of 10 m3/day). After this point the actual withdrawal rate is only 10 m3/day (which is the inflow) rather than the requested 20 m3/day (as discussed when describing the Withdrawal_Rate output in Unit 7, Lesson 5).
As a result, the demand with the “highest” priority (Trenton) receives its full demand (8 m3/day), but the demand with the “lower” priority (Cambridge) only receives 2 m3/day (instead of 10 m3/day), as that is all that is available. Of course, at this point, the amount that is unused drops to zero (in fact, after 25 days, the total demand is no longer met).