Courses: Introduction to GoldSim:
Unit 7 - Modeling Material Flows
Lesson 7 - Exercise: Redirecting Flows
In this Lesson we will carry out an Exercise that uses a Splitter. We are going to start with the model we built in the previous Exercise. You should have saved that model and named it Exercise4.gsm. Open the model now. (If you failed to save that model, you can find the Exercise, named Exercise4_Overflow.gsm, in the “Exercises” subfolder of the “Basic GoldSim Course” folder you should have downloaded and unzipped to your Desktop.)
You may recall that in that model, we simulated a pond that was assigned a capacity (an Upper Bound), and the pond started to overflow after approximately 34 days.
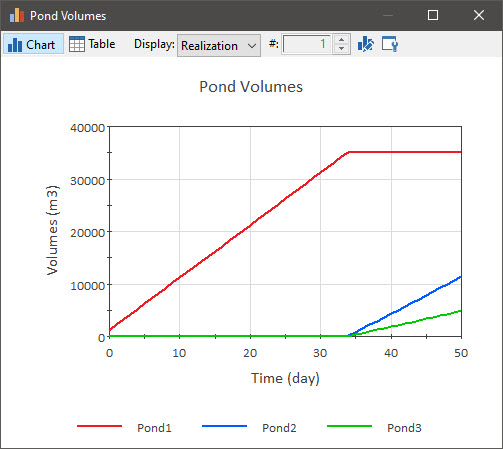
In this Exercise, we want to route the overflow from that pond to two other ponds. We will use a Splitter to send 70% of the flow to one pond and the remainder to the other. We then want to plot the volume of all three ponds on a single chart. To do so, you should do the following:
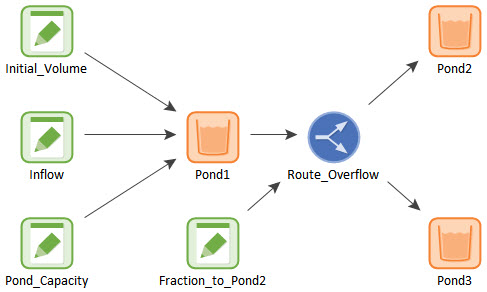
- Create a Data element named “Fraction_to_Pond2”. Define it as 70%.
- Create a Splitter element named “Route_Overflow”. The Display Units should be specified as m3/day. The Amount should be defined as the overflow rate from the pond (if the pond is named “Pond1”, this will be “Pond1.Overflow_Rate”). The Splitter element should have two outputs (named “to_Pond2” and “to_Pond3”). The Fraction to the first output should be specified as “Fraction_to_Pond2”.
- Create two additional Reservoirs named “Pond2” and “Pond3”. The Addition Rate to Pond2 should be “Route_Overflow.to_Pond2”. The Addition Rate to Pond3 should be “Route_Overflow.to_Pond3”.
- Run the model for 50 days with a 1 day timestep.
- Create a new Result element (named “Pond Volumes”) that plots three results: Pond1, Pond2, and Pond3. Change the Y-axis label from “%rlabel% %(unit)%” to “Volumes %(unit)%”
Stop now and try to build and run the model.
Once you are done with your model, save it to the “MyModels” subfolder of the “Basic GoldSim Course” folder on your desktop (call it Exercise5.gsm). If, and only if, you get stuck, open and look at the worked out Exercise (Exercise5_Route_Overflow.gsm in the “Exercises” subfolder) to help you finish the model.
We have covered everything you need to know in previous Lessons to create this model, hence we won’t walk through it in detail here. Your model structure should look like this:
The result chart should look like this: