Courses: Introduction to GoldSim:
Unit 10 - Building Hierarchical Models
Lesson 7 - Exercise: Localized Containers
Now that we have learned the basics of localized Containers, let’s do an Exercise to get a bit more comfortable with them.
We are going to start with a model we built in a previous Exercise. You should have saved a model named Exercise7.gsm. Open the model now. (If you failed to save that model, you can find the Exercise, named Exercise7_Evaporating_Pond.gsm, in the “Exercises” subfolder of the “Basic GoldSim Course” folder you should have downloaded and unzipped to your Desktop.)
This simple model has an evaporating pond. We are going to create two additional ponds with the exact same structure. Each pond is going to be placed in a localized Container. Finally, we are going to sum the volume of all three ponds.
The basic steps for doing this are outlined below:
- Rename the Pool from “Pond” to “Volume”.
- Create a localized Container and name it Pond1.
- Move all of the elements into the Pond1 container.
- Now copy and paste that Container twice. Name the new Containers Pond2 and Pond3.
- Make the Inflow for Pond2 20 m3/day and the Inflow for Pond3 30 m3/day.
- At the top level, use a Sum element to add the three volumes. Note that you will need to expose these outputs in order to do so.
Stop now and try to build and run the model.
Once you are done with your model, save it to the “MyModels” subfolder of the “Basic GoldSim Course” folder on your desktop (call it Exercise13.gsm). If, and only if, you get stuck, open and look at the worked out Exercise (Exercise13_Localized_Containers.gsm in the “Exercises” subfolder) to help you finish the model.
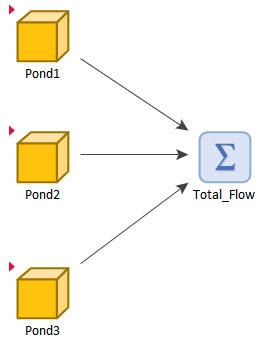
Your model structure should look something like this:
When you added the Volume outputs to the Sum element, you should have gotten this message:
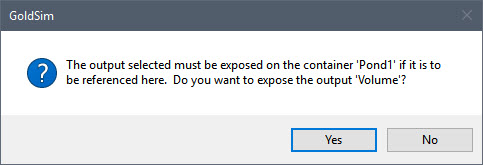
You would have needed to answer Yes each time to expose the three Volumes.
The Sum itself should look like this (with each Volume referenced as ContainerID.OutputID):
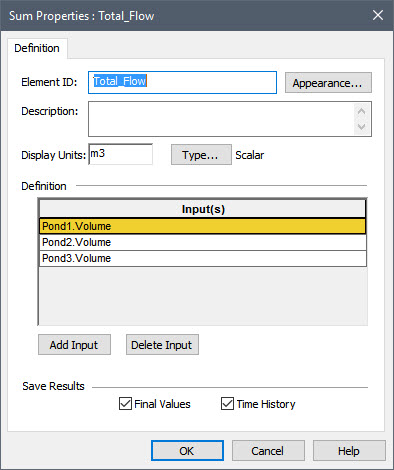
Note how consistent and transparent it is for each volume output to have the same name (Volume), with the first part of the name prior to the dot making it clear which pond is being referred to.