Courses: Introduction to GoldSim:
Unit 14 - Modeling Discrete Events
Lesson 2 - Basic Discrete Event Modeling Concepts
In GoldSim, a discrete event is something that occurs instantaneously (as opposed to continuously or gradually) in time. It represents a “spike”, a discontinuity, an “on/off” switch, or a discrete change of state for the system.
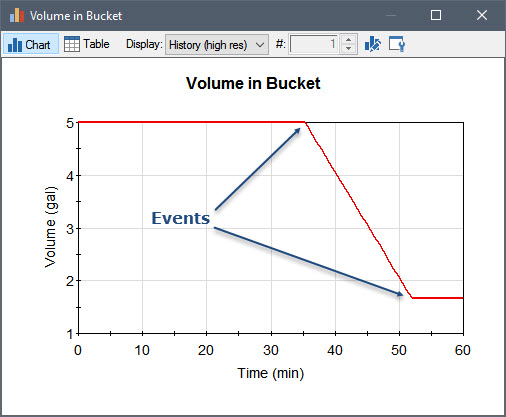
The flow of water out of a hole in bucket is a continuous process (as long as water remains in the bucket). Puncturing the bucket to create the hole is a discrete event. Stopping the flow from the bucket (e.g., by plugging the hole) is also a discrete event:
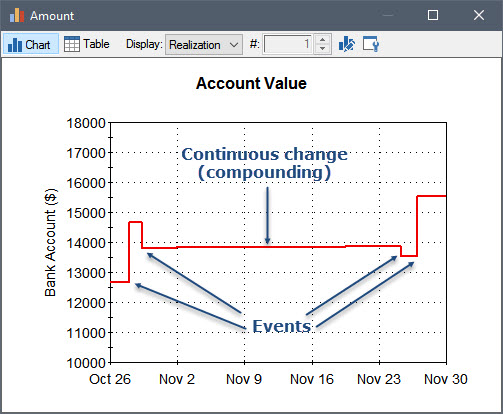
Similarly, through continuous compounding of interest, the money in a bank account continuously increases, but the account can also increase and decrease instantaneously due to discrete events (i.e., deposits and withdrawals):
Of course, “instantaneous” and “continuous” are relative terms. That is, whether something is treated as instantaneous or continuous is a function of the time scale of interest, and hence you must differentiate between the two based on the context of your model. Typically, the differentiation will be obvious. For example, in the case of the leaking bucket (in which the time scale of interest is perhaps an hour), if it took 10 seconds to plug the leak, this could be considered to be “instantaneous”. However, it if took ten minutes to plug the leak, we’d probably want to treat that in a continuous manner (e.g., the leakage rate would slowly decrease over ten minutes instead of decreasing suddenly).
GoldSim allows you to represent “instantaneous” changes to a model by providing a mechanism for your model to generate and respond to events. This is accomplished by 1) providing the ability to generate events in a number of different ways, and 2) allowing such events to instantaneously trigger various elements to take a particular action (e.g., instantaneously change their value).
In GoldSim, an event can be generated in one of four ways:
- The event occurs when a specified condition (e.g., X > Y) becomes true or false;
- The event occurs when a specified output in the model changes;
- The event occurs at a specified calendar or elapsed time; or
- The event occurs based on a specified rate of occurrence, which can be treated as regular or random ("occur exactly once a week" or "occur, on average, once a week").
Note: The fourth mechanism provides another way for you to generate a stochastic process in GoldSim (i.e., defining an event that occurs randomly).
Note: The GoldSim Reliability Module (a specialized extension to GoldSim that we will discuss briefly in Unit 18) consists of elements that provide a fifth way to generate events. In particular, that module provides elements that can be used to represent random failures and repairs (e.g., of equipment). These failures and repairs are events.
In addition, some elements can respond to an event generated via one of the mechanisms above, and generate a new event.
Once an event is generated, a variety of GoldSim elements can be triggered by the event, with each element responding to the event (taking a particular action) in a different manner.
In the next Lesson, we will begin our exploration of discrete event modeling in GoldSim by generating an event using the fourth method listed above (the event occurs based on a specified rate of occurrence).