Courses: Introduction to GoldSim:
Unit 14 - Modeling Discrete Events
Lesson 6 - Responding to an Event: Causing a Discrete Change to a Quantity
One of the most powerful (and common) ways a model can respond to an event is to cause a discrete (i.e., sudden) change to a quantity. Perhaps the simplest example of this are additions and withdrawals from a bank account. These are instantaneous changes to the account (they cannot be represented using rates of change).
A quantity is a measure of the “amount” of something. It is often something that is material (e.g., water), but it does not have to be (e.g., a distance is a quantity). All “quantities” in a model are state variables (discussed in Unit 8, Lesson 3). State variables are typically the key system variables that you are interested in predicting. Together, the state variables define the predicted state of the system at any time in the future. Examples of state variables include the volume of water in a pond, the amount of money in an account, the number of widgets in a warehouse, and the status (on/off/failed) of a piece of equipment. Note that although all quantities are state variables, not all state variables are quantities (e.g., the status of a piece of equipment is not a quantity).
In GoldSim, a “quantity” is generally represented by one of three types of elements: a Pool, a Reservoir or an Integrator. (Several of GoldSim’s specialized add-on modules include elements that are used to represent quantities also, but these will not be discussed in this Course). So causing a discrete change to a quantity in GoldSim involves causing a discrete change to a Pool, Reservoir or Integrator (we will focus on the Pool here).
To illustrate this, we are going to revisit an Exercise from a previous Unit. In particular, we are going to open a model you should have saved and named Exercise8.gsm. Open the model now. (If you failed to save that model, you can find the Exercise, named Exercise8_Evaporating_Pond2.gsm, in the “Exercises” subfolder of the “Basic GoldSim Course” folder you should have downloaded and unzipped to your Desktop.)
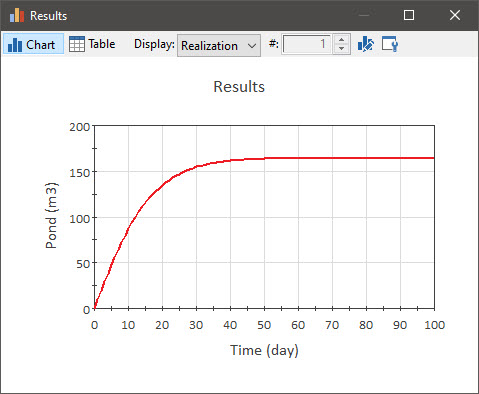
Open that file and refresh your memory on what we did in that simple model. Recall that this model simulated a pond with a constant inflow that was evaporating. The result looked like this:
Let’s assume that what we want to simulate is someone adding (instantaneously) 25 m3 of water at 65 days. Of course, it is not really possible to do this instantaneously, but as we discussed earlier in this Unit, “instantaneous” is a relative term. Since this particular model has a 1 day timestep, something that happened over a time scale significantly less than that (e.g., 1 hour) would be considered “instantaneous” relative to the other dynamics in the model.
So how can we do this? Let’s make sure the model is in Edit Mode, and open the Pool element. It looks like this:
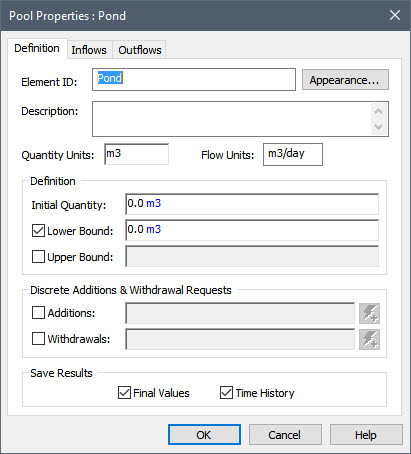
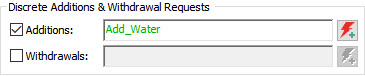
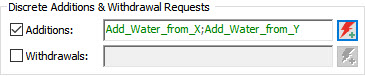
The Inflows and Outflows are entered on the other two tabs. Note that these Inflows and Outflows are continuous flow rates, so we can't add this discrete change on those tabs. You may have noticed before, however, that on the main (Definition) tab the Pool dialog has two fields labeled Additions and Withdrawals under the section called "Discrete Additions & Withdrawal Requests". What are these? These fields are specifically intended to represent discrete additions and withdrawals (as opposed to the continuous addition and withdrawal requests added on the Inflows and Outflows tabs).
By default they are not active (each has a checkbox to activate it). Let’s activate the Additions field now. After doing so, let’s type 25 m3 into the Additions field to represent a discrete addition. When you do so, you will see that GoldSim provides an error message:
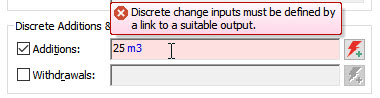
As can be seen, this input field does not accept an input like this. Why? The reason is that this input field requires two pieces of information: 1) "how much?” and 2) “when?”. Simply entering “25 m3” provides the first piece of information, but not the second. It does not tell GoldSim when to add the 25 m3.
As a result, this particular input field only accepts a very special type of output: a discrete change signal. A discrete change signal can be generated by a number of elements, but the most important of these is the Discrete Change element. Let’s look at one now. You will find the Discrete Change under the element category “Events”. The dialog looks like this:
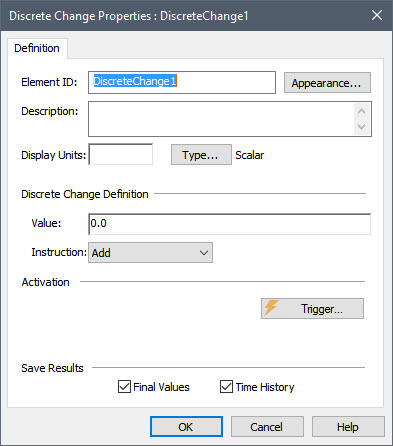
Let’s rename this element “Add_Water”. A Discrete Change then requires three things:
- a Value;
- an Instruction; and
- One or more triggers.
The Value is the amount of the discrete change. In our case, this should be 25 m3. Note that the Display Units are those associated with the Value. So in this case, this should be set to a volume (e.g., m3).
The Instruction instructs GoldSim what to do with the discrete change signal that will be generated by this element. You will see that the drop-list has three options: “Add”, “Replace” and “Push”. We will only discuss the first two here. The third is an advanced option for a highly specialized application (modeling aging chains) that is beyond the scope of this Course.
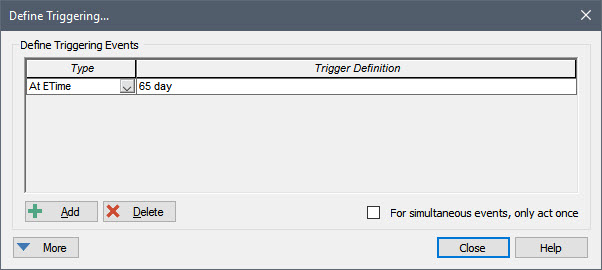
For now, leave this at the default (“Add”). Finally, we must specify the triggering events that will generate the discrete change signal. If you press the Trigger… button you will see that it provides access to the standard Triggering dialog. In this case, we simply want to trigger the element at ETime = 65 days:
So what are the outputs of a Discrete Change element? Left-click on the output port of the element, to show its output interface with all of the element’s outputs (indented under the element name). What you will note here is that there is one output that has the same name as the element itself (recall that this is referred to as the primary output), as well a secondary output named “EventCount”:
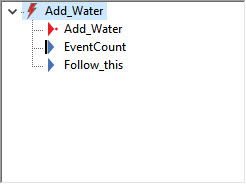
The EventCount output is simply an integer that represents the cumulative number of discrete change signals emitted (the Timed Event and Triggered Event elements have the same output).
The key output of interest here is the primary output (the one with the same name as the element). Like the primary output of the Timed Event and Triggered Event, this is a discrete signal. As such, it cannot be plotted. Recall that a discrete signal is not a number; it is a signal that is sent between elements (at a specific instant in simulated time) indicating that something (e.g., an earthquake, a bank deposit, an equipment failure) has occurred precisely at that instant, to which the element needs to respond. The output of a Discrete Change element is a special type of discrete signal called a discrete change signal. A discrete change signal does not just carry information indicating that something has occurred; it also carries information indicating what has occurred (i.e., how much, and what is to be done with it – the instruction).
This is the only type of output that can be entered into the Additions or Withdrawals input field for the Pool. Let’s do that now. Enter the discrete change signal output into the Additions input field:
Note: This field would not accept the discrete signal from a Timed Event or Triggered Event. It only accepts discrete change signals, since these not only include information pertaining to when the event has occurred, but also include information regarding what has occurred (a Value and an Instruction).
Run the model now and look at the results (the volume of water in the pond):
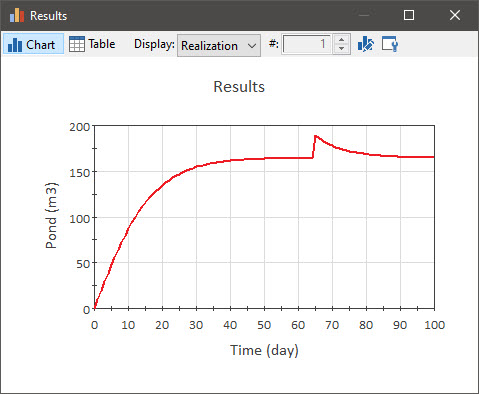
As can be seen, there is a “spike” increase at 65 days.
What if we wanted to do a discrete withdrawal as opposed to a discrete addition? You may recall the Instruction for a Discrete Change element must be either “Add” or “Replace” (or the advanced option “Push”). To do a discrete withdrawal, you also use an “Add” instruction, but the input goes into the Withdrawals field instead of the Additions field.
Note: An Integrator only has a single field for discrete changes. In this case, to do a discrete withdrawal, you would make the Value negative.
What happens if we change the Instruction to “Replace”? Let’s do that now and find out. Return to Edit Mode and edit the Discrete Change element. Change the Instruction to “Replace” and rerun the model.
The result will look like this:
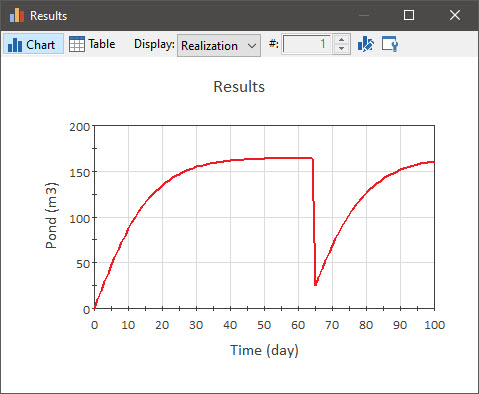
As can be seen, the value of the Pool is replaced by the discrete change value. This is useful for resetting a quantity to a specified value.
Finally, it should be noted that you can have multiple discrete changes in the Additions or Withdrawal fields. When you do so, they must be separated by semicolons:
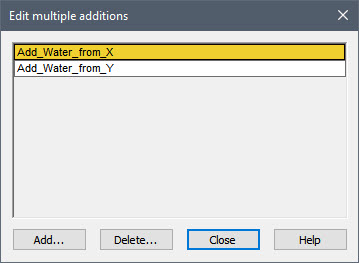
You can also press the button immediately to the right of the Additions or Withdrawals fields to enter the list of discrete changes:
We have not covered all of the details of Discrete Change elements, but have covered all that you need to get started using them. You can read more about the Discrete Change element (and the advanced features we did not discuss) in GoldSim Help.