Courses: Introduction to GoldSim:
Unit 16 - Documenting Your Model
Lesson 3 - Adding Graphics and Text to Your Model
Once you have organized your model, one of the most powerful ways to document your model is to use GoldSim’s features for adding graphics (an image or a simple schematic) and text to the graphics pane.
The actual use of these tools is relatively straightforward (they all are based on standard Windows conventions). Hence, we will not spend much time walking through in detail how to actually use them (as you can easily experiment for yourself). Rather, this Lesson will focus on making you aware of the tools that are available and the kinds of things they can do.
The Graphical Tools toolbar in GoldSim provides access to a number of buttons for adding images, graphics and text to your model:
The Graphical Tools toolbar is present by default to the right of the Element Categories toolbar (in the image above it is floating).
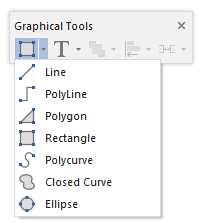
The first button in the toolbar can be used to insert various shapes and objects:
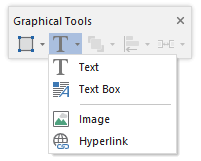
The second button can be used to insert text, images and hyperlinks:
The same functions can also be accessed under Graphics|Insert in the main menu.
Most of the graphics object buttons (or graphics menu options) operate in the same way: when you select a button or a menu option, the cursor changes its appearance (which varies slightly in appearance depending on the option). For example, if you select any of the lines, shapes or curves, the cursor simply becomes a plus sign:

If you select the Text object, it is a cursor with text:

Clicking (and in some cases, subsequently dragging) in the graphics pane with the cursor allows you to insert the object at that point.
Let’s start by exploring the two text objects (Text and Text Box). Insert a Text object. It will look like this:
Double-clicking on a text object in the graphics pane selects the text (it will be highlighted in blue). If you start typing while the entire text is highlighted in blue, the text will be overwritten. Once the text is selected, clicking anywhere within the text places the cursor at that location. A single click on a text object selects the object, but does not select the text itself. You can move a text object by selecting it and dragging it around the graphics pane. Eight "handles" will be visible, defining the limits of the textbox (one at each corner, and one on each side). By default, word-wrap is on, so the text will wrap around given a specified width. As you type, the textbox will automatically expand downward.
The default font which is used is defined in the Graphic tab of the Options dialog (accessed via Model|Options in the main menu). To edit the properties of a text object (in fact, any object), right-click on it (to access its context menu), and select Appearance…. A dialog will appear that allows you to modify the appearance.
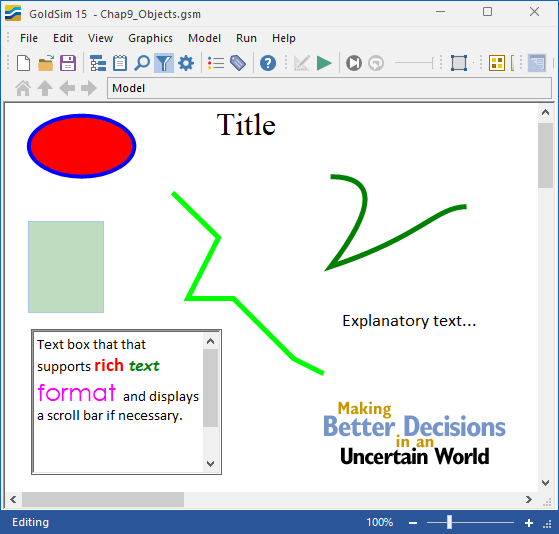
Text objects are usually used for Titles and simple labels (in the example below, the bold text are Text objects):
Take a moment to insert a Text object now to experiment with it.
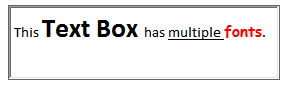
If you want to add a significant amount of text (and want more control over its appearance), you would use a Text Box. Whereas Text objects are movable objects that can only utilize a single font, Text Boxes are scrollable boxes of text that can simultaneously utilize multiple fonts and can be “pinned” to a specific location in the graphics pane:
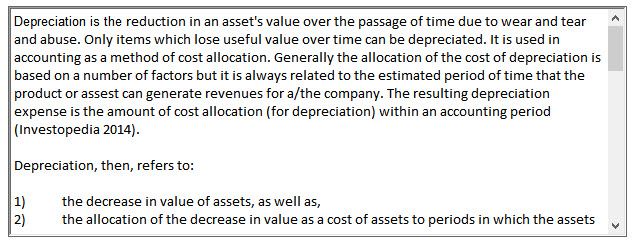
Text Boxes have many powerful options. In addition to having the ability to scroll (with or without a border), they support the simultaneous use of multiple fonts:
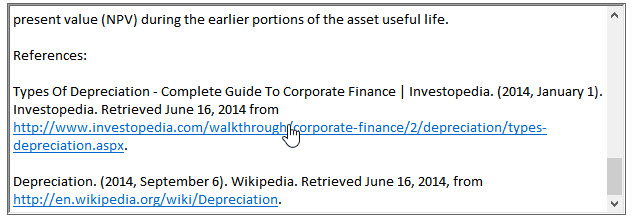
You can even insert a hyperlink into the text, allowing users to jump to another document (e.g., a web site or any document) for further information:
Use of Text Boxes is largely self-explanatory. Take a moment to insert a Text Box object now to experiment with it. Adding a Text Box consists of two steps:
1. Select Text Box from the Drawing Toolbar or the main menu under Graphics|Insert.
2. Place the cursor at the location in the graphics pane where you want the text box to be inserted, left-click, drag the cursor to specify the size of the box, and release the mouse button.
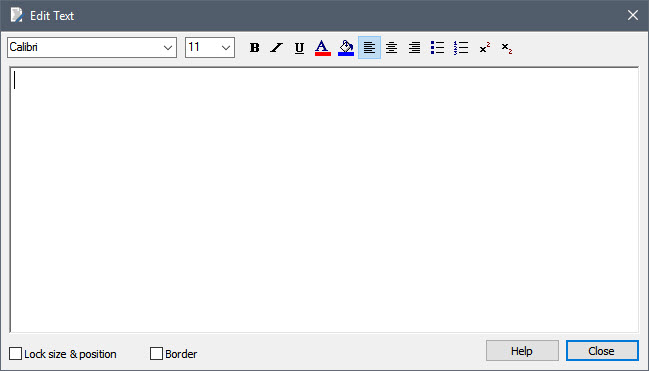
At this point the text box will be inserted into the graphics pane and the dialog for editing the text box will be displayed:
The first seven buttons in the Graphical Tools toolbar (Line through Ellipse) are simple drawing tools that allow you to add various lines and shapes to the graphics pane. How you use these is only limited by your creativity. One of the most common uses is to use the Rectangle tool to outline or highlight groups of objects:
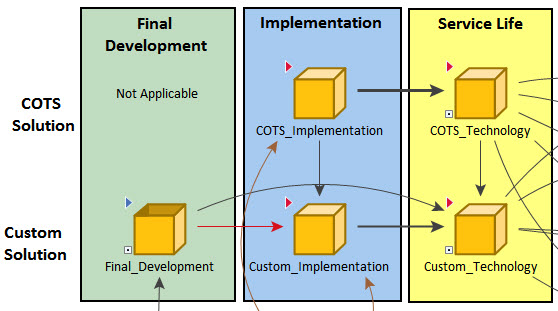
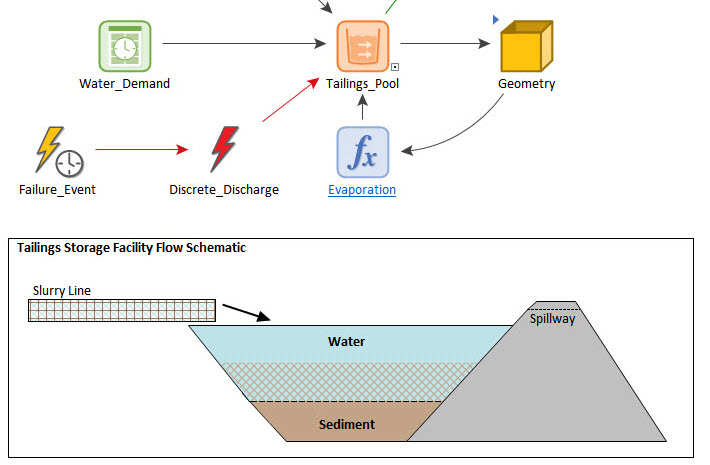
However, you can also use these tools to draw simple schematics to document your model, such as in this example:
Take a moment to insert some of these line and shape objects now to experiment with them.
The last thing we will discuss in this Lesson is inserting images. When you press the button for inserting an image, you will be prompted for a file. Take a moment to insert an image now.
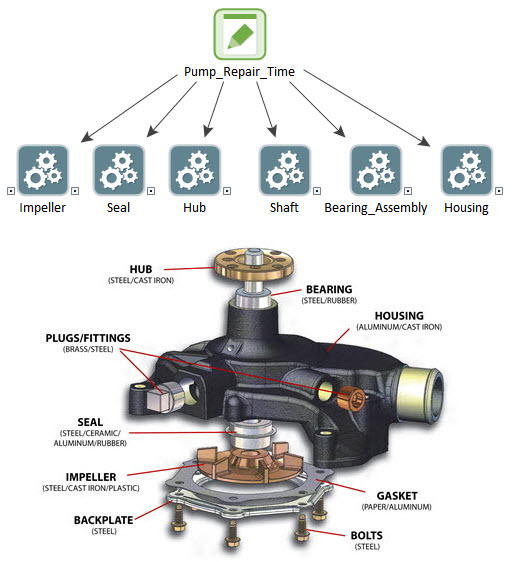
This is a simple but powerful feature that allows you to insert things like photographs, complex graphics and maps to your graphics pane in order to document your model:
There are numerous places in the GoldSim user interface where you can specify colors for different objects (e.g., backgrounds, text, chart lines). GoldSim selects default colors for all items, so it is not necessary for you to edit these. However, in many cases, you may want to, so GoldSim provides a number of tools for selecting and customizing the colors you use in your model. This includes saving custom colors to your registry so they can be used for all of your models, as well as exporting your custom colors so the same color scheme can be shared and used on other computers.