Courses: Introduction to GoldSim:
Unit 16 - Documenting Your Model
Lesson 8 - Modifying and Filtering Influences
As was noted very early in the Course, when you link one element to another (e.g., by writing an equation in an input field for the element that references the name of an output of another element), GoldSim automatically draws an arrow (referred to as an influence) between the elements. The influence visually indicates the dependency of one element on another.
We have also noted previously in the Course that the colors of the influences can change depending on the type of information they contain. In particular, we noted the following:
- If the influence represents a value (a number), it is black;
- If the influence represents a condition (i.e., True/False), it is green; and
- If the influence represents a discrete signal (also referred to as a transaction), it is red.
We can see all three types of influences in this simple model:
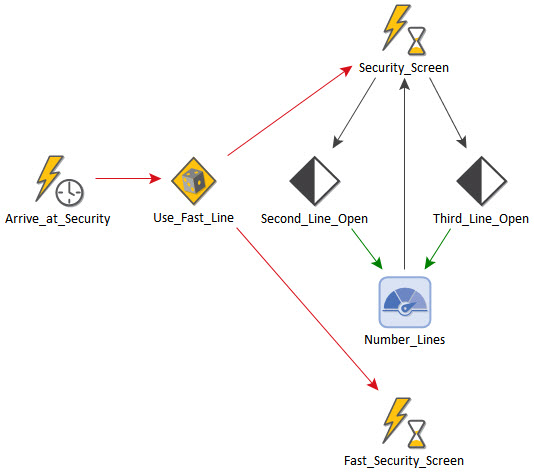
This was one of the models of a security checkpoint that we discussed in Unit 14, Lesson 10. You can see three black influences, two green influences, and three red influences. Like other features in the GoldSim interface, these provide valuable visual cues when viewing a model.
Where do these colors come from, and can they be changed? To answer this, start with a new model and right-click in any blank space in the graphics pane, and from the context menu, select Properties… This provides access to the Properties dialog for the Container that is being viewed. In this case, it is the Properties dialog for the “Model” Container (i.e., the top-level Container). As such, it has a number of tabs that the Properties dialogs for other Containers do not have. However, we need only focus on the Graphics tab (it will open to this):
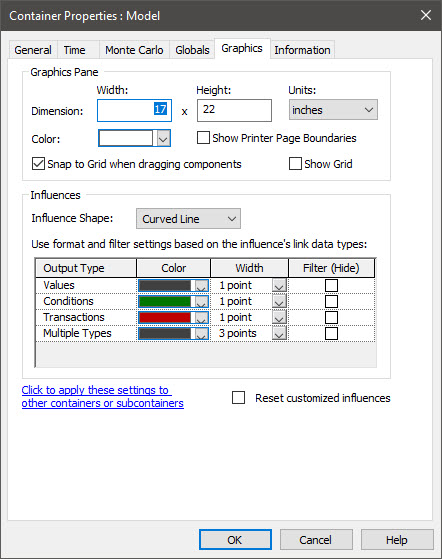
In the “Influences” section of the dialog, your will notice that the default colors for Values (black), Conditions (green) and Transactions (red) are listed. Note that there is a fourth category (Multiple Types) that is a thicker dark line (this is for influences that represent multiple types of information, and can only occur when the influence is coming from a Container). You can change these if you wish, but as a general rule it is recommended that you do not do so, as this could make it more difficult for others to understand the model (as they will likely be used to the default colors).
Although in most cases you do not want to change the default colors for all the influences of a particular type, in some cases, changing the appearance of some of the influences may be of value. For example, what if you wanted to highlight a specific influence (so it jumps out when people look at it)? GoldSim provides a mechanism to do this.
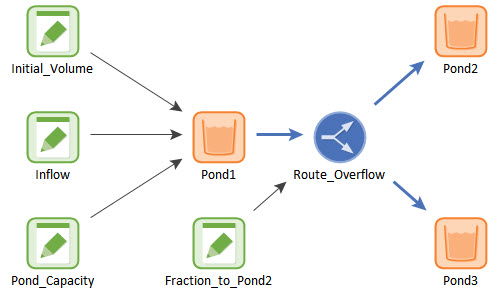
To illustrate this, let’s open a model we have seen before. In particular, we want to open Exercise 5 (Exercise5_Route_Overflow.gsm in the “Exercises” subfolder of the “Basic GoldSim Course” folder you should have downloaded and unzipped to your Desktop). The model looks like this:
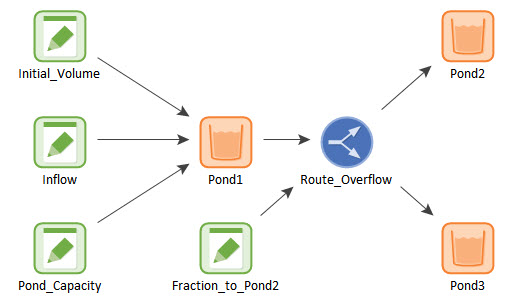
In this model, the influences from Pond1 and to Pond2 and Pond3 represent flows of material. Therefore, it might be of value to highlight these in some way. We can do this by right-clicking on an individual influence. A context menu will appear:
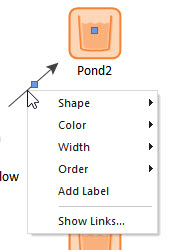
Among other things, you can change the Color and the Width of the influence from this menu. Change these three influences now so that they are blue and 3 points in width:
You can also associate text with an influence. To do so, right-click on the influence and select Add Label from the menu (and then simply enter the text you want):
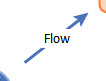
As can be seen, these tools provide an effective way to highlight certain influences. You can read about other properties of influences (e.g., changing the shape) in GoldSim Help.
In most Containers, you want to view all of the influences (as they provide valuable information). But in some Containers, there may be so many elements and links that showing the influences makes the Container look like a spider web that adds no real value when viewing the graphics pane. In these cases, it can be valuable to hide some (or all) of the influences.
As an example, consider the following Container:
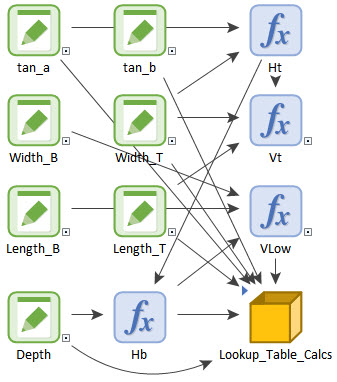
This is part of a model that calculates some geometric factors that are used elsewhere in the model. The influences really don’t add any clarity here, so this is a good example of a Container where you might want to hide the influences:
This is an example from deep within the containment hierarchy of a model. But more commonly, you might want to hide the influences at the very top of a model. This is because at the top of the model, the primary objects may be Containers (and a handful of other elements), and the influences between these objects may not necessarily be informative. To illustrate this, consider this example:
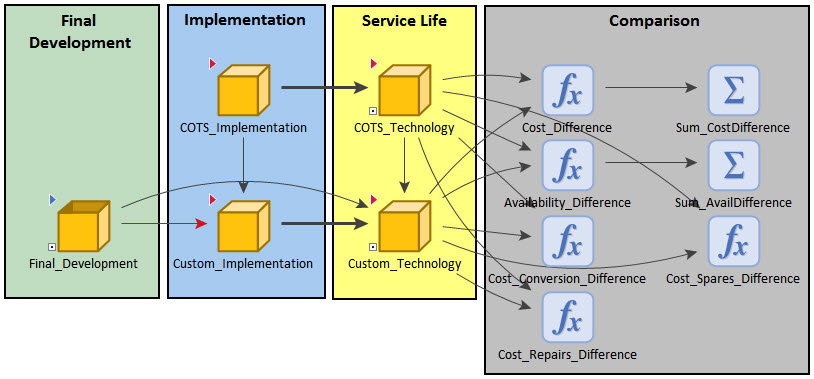
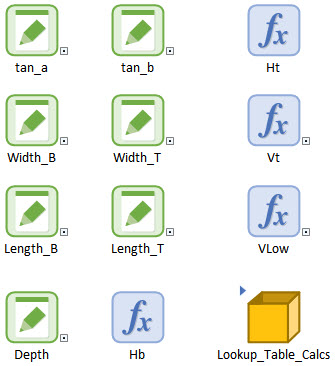
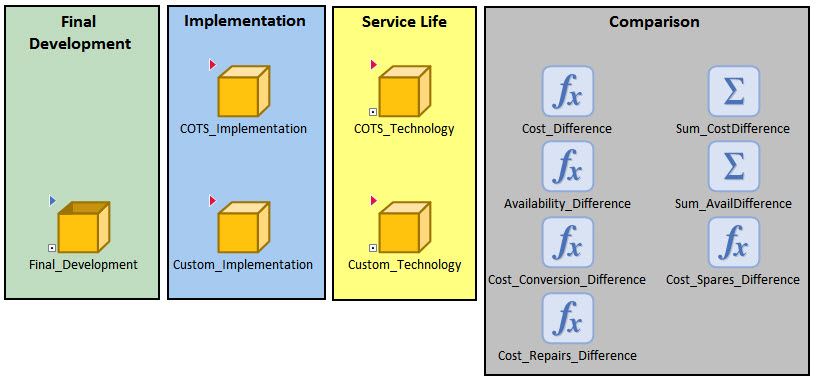
This is the top-level of a model. It consists of a number of Containers, and then some key calculations (Expressions and Sums). Again, the influences don’t really add any clarity here, and hiding them improves the appearance of the Container:
So, how do we go about hiding influences like this? To illustrate how to do this, let’s open the security line example we mentioned in the beginning of this Lesson (Example28_TSA2.gsm in the “Examples” subfolder of the “Basic GoldSim Course” folder you should have downloaded and unzipped to your Desktop):
Although this is certainly not a model that needs the influences to be hidden, it provides a simple model that we can use to illustrate how it can be done. To do so, we need to open the Properties dialog for the Container (as we did at the beginning of this Lesson) by right-clicking anywhere in an empty portion of the graphics pane and selecting Properties…:
Note that in the “Influences” section to the immediate right of the Color and Width, there is an option to Filter (Hide). By checking this box for a particular type (e.g., Value, Condition, etc.) you can hide influences that represent that type of information in the current Container. Do that now for Values and Conditions (don’t check the box for Transactions).
When you then close the dialog, you will note that the influences are not hidden. This is because filtering influences is a two-step process. First you need to check the boxes in the Container Properties dialog. After doing so and closing the Properties dialog, you then need to press the Show/Filter Influences button in the toolbar:

Pressing this button will hide the Value and Condition influences. Pressing it again will “turn off” the filter and display them again.
A number of important points should be kept in mind when filtering influences:
- Filtering influences has no impact on the model at all. That is, the links between elements still exist; they simply are no longer visible via influences.
- The state of the Show/Filter Influences button is saved with the model file. So if filtering in on when you save the model, it will be on the next time the model is opened also.
- The Filter (Hide) checkboxes (like all the other default influence settings in the Container Properties dialog) only apply to the Container for which they were defined. Hence, you can choose to filter influences in some Containers, but not others.
- Filtering influences should generally be done with great care, since if someone views the model and does not understand that the influences are filtered, they could misinterpret the model structure. The only indication that influences are being filtered is that the Show/Filter Influences button appears to be pressed.
You can learn more about filtering influences in GoldSim Help.