Courses: Introduction to GoldSim:
Unit 4 - Building a Simple Model
Lesson 9 - Viewing Results and Creating a Time History Result Element
Let’s now view a result from the model we completed in the previous Lesson.
As we discussed previously, you can view the results of any element by right-clicking on the specific element you wish to view, and selecting a result type.
- Right-click on the Tank. The following context menu will be displayed:

- Let’s select Time History Result… to view a time history display. It will look like this:
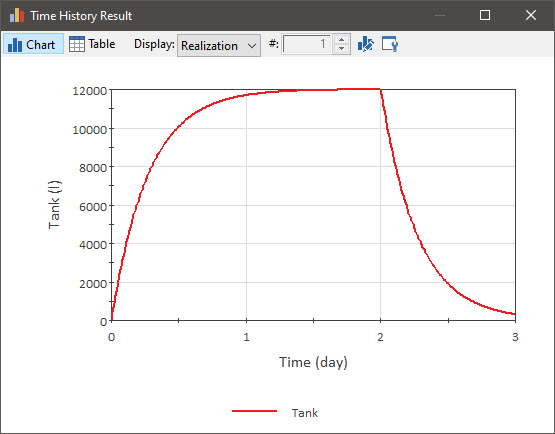
We see that the tank fills up over the first two days (and reaches a steady value), and after we turn off the hose, is nearly empty again by 3 days (since the tank leaks).
By the way, you may recall that we defined a Tank_Capacity (of 30,000 l). As seen above, the tank never approached its capacity. As we will see in a subsequent Unit, had the tank actually reached its capacity, GoldSim would have handled this in an appropriate way (the tank would have overflowed, and an overflow rate would have been calculated). - You could close the window by clicking on the X in the upper right hand corner of the window. But let’s not do that now. Instead, we are going to create a Time History Result element. Result elements are special elements that allow you to easily view and format results. To turn the result we are viewing into a Result element, press the Edit Properties… button at the top of the dialog:

The following dialog will be displayed: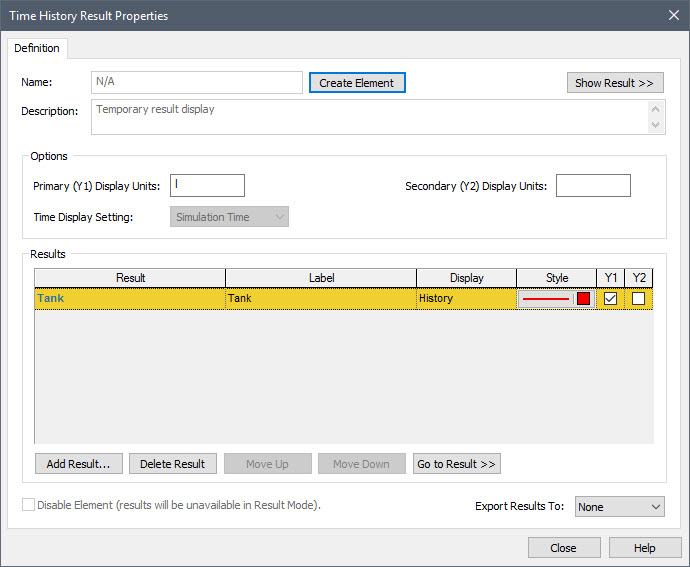
- Now press the Create Element button to create a Result element. The dialog will change:
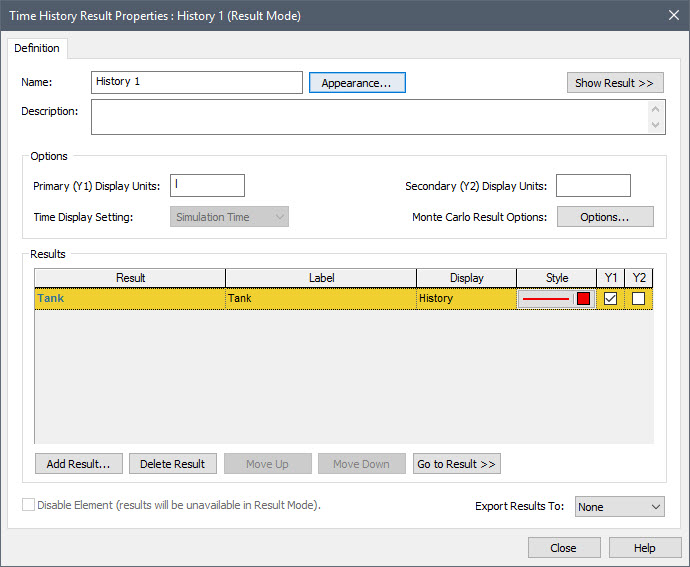
This is the Properties dialog for the Result element. Let’s change the Name to Tank Volume (as we will discuss in a subsequent Unit, unlike other elements in GoldSim, Result element names can have spaces). - Press the Close button. You should now notice a new element (Tank Volume) has been inserted.
- Double-click on Tank Volume. The chart will be displayed again.
- Let’s make a couple quick edits to make the chart look a bit cleaner. First, we don’t need to display the Legend. Right-click anywhere in the chart. From the dialog, go to View | Show Legend, and select it (to clear the check).
- Next, let’s change the label of the y-axis. Press the Edit Properties… button at the top of the dialog again:
- By default, the y-axis in a Time History chart is labeled using the Label for the first (in this case, the only) item in the list of Results being plotted. The Label defaults to the name of the output (in this case “Tank”).
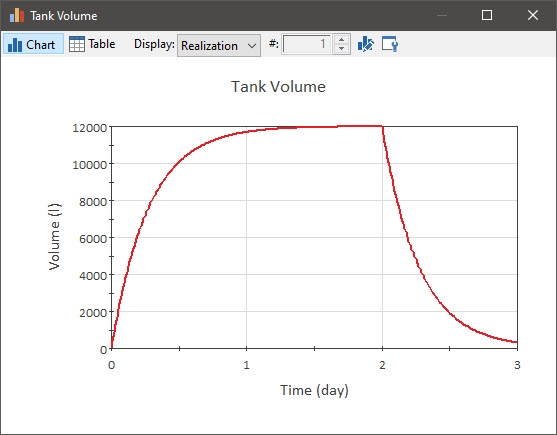
- Let’s change the Label to “Volume”.
- Press the Close button. The chart should now look like this:
- You can close the chart by pressing the X.
- Although we won’t need this model again, in case you would like to revisit this model sometime in the future, save your model to the “MyModels” subfolder in the “Basic GoldSim Course” folder (by pressing File|Save from the main menu, Ctrl+S, or the Save button in the toolbar).